Flash floods in the French western and central Pyrenees (17-19 June 2013)
Source: La Dépêche du Midi
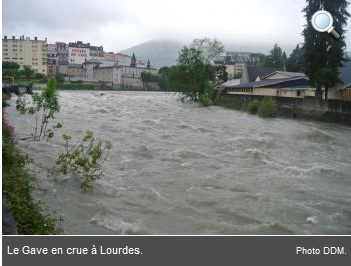
Between June 17th and 19th, a heavy rain episode touched the western and central Pyrenees. Combined with the contribution of snowmelt due to warming temperatures, they caused severe floods in Southwest France, particularly in the Gave de Pau river basin and in the upstream parts of the Garonne river.
On Monday 17th evening, the French weather service Météo-France had placed several departments in the south west and west of France on ‘orange’ alert for heavy rain and storms, which is the third of a four-level warning scale. On Tuesday 18th afternoon, the highest warning level (‘red’) could be seen in both the meteorological and the flood warning maps issued by Météo-France and the French National Hydro-meteorological and Flood Forecasting Centre, SCHAPI. This alert level was only lifted on Wednesday 19th night.
- Below the meteorological warning map issued on June 19 at 00:03 AM, the corresponding flood warning map issued on June 19 at 03:54 AM and a zoom on the area with the highest alert level (red colour).
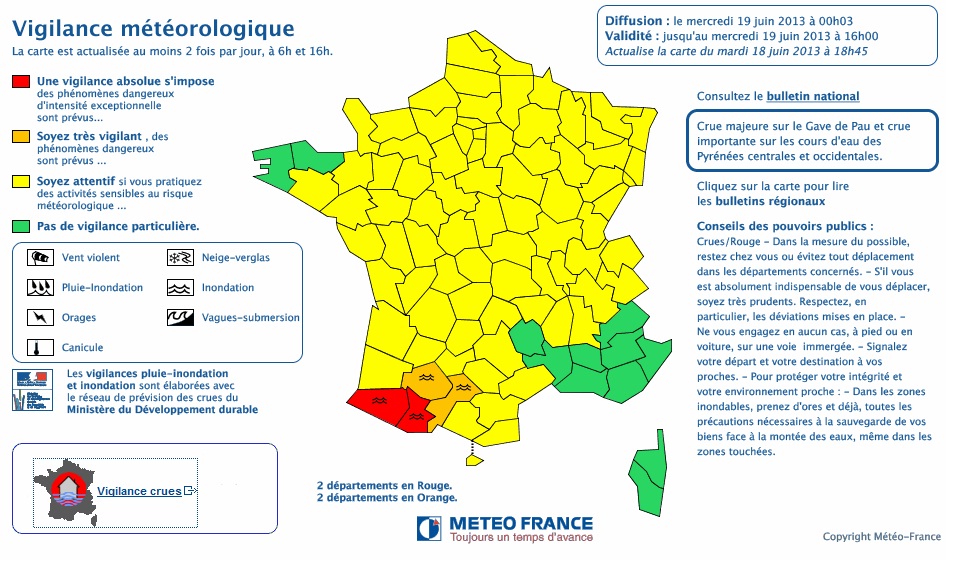
Source: Météo-France

Source: Vigicrues
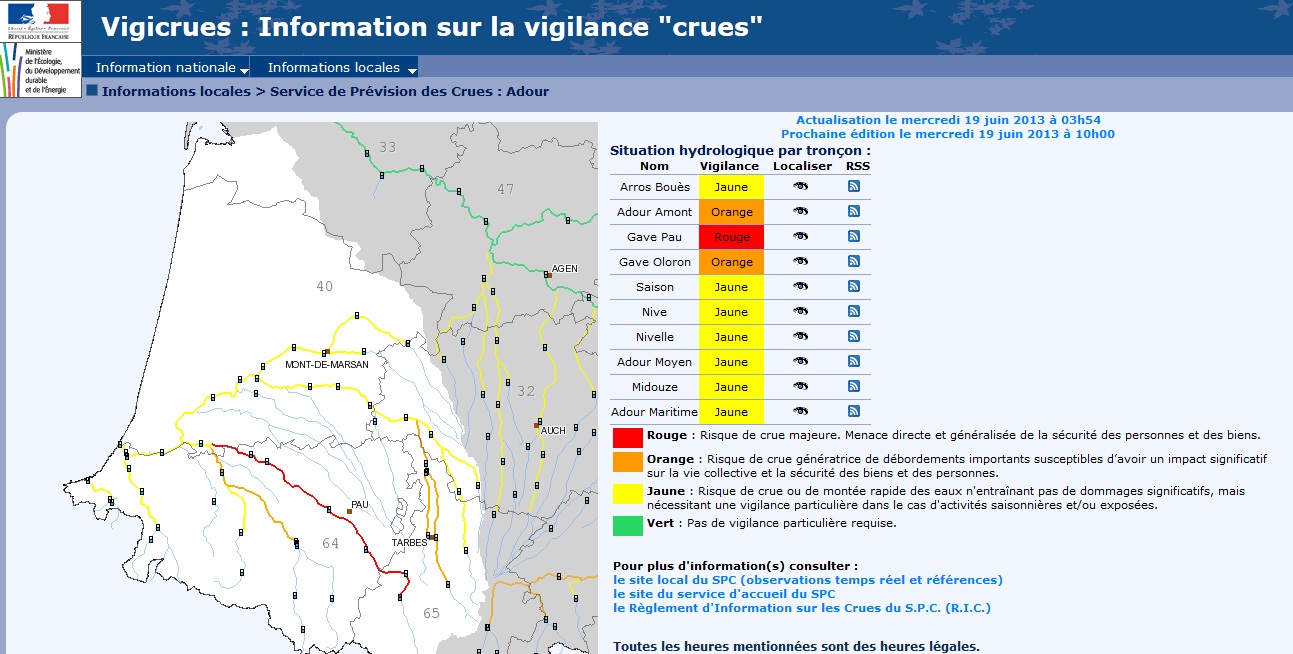
Source: Vigicrues
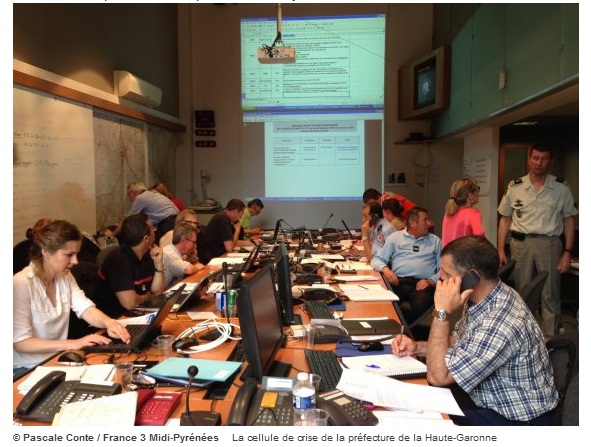
Several crisis management plans (‘cellulles de crise’) were activated in Haute-Garonne and Hautes-Pyrenees. During crisis management, a small number of people with different skills (decision-makers, experts, professionals in communication, emergency services, rescue forces, etc.) work together in a central location for the command and control of major disasters. The aim is to centralize information, organise civil protection services, coordinate responses and define communication strategies.
On Friday June 21st at 3:52 PM several rivers in the south west (Adour-Garonne river basin) were still on the second alert level (‘yellow’).

Source: http://www.vigicrues.gouv.fr/ (Actualisation le vendredi 21 juin 2013 à 15h52)
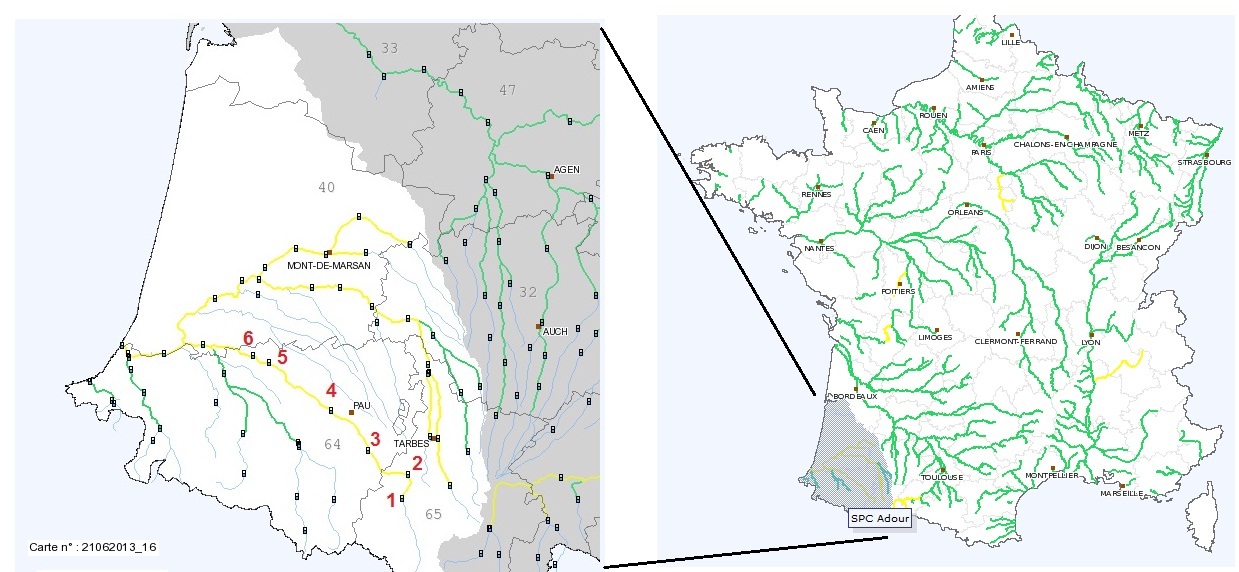
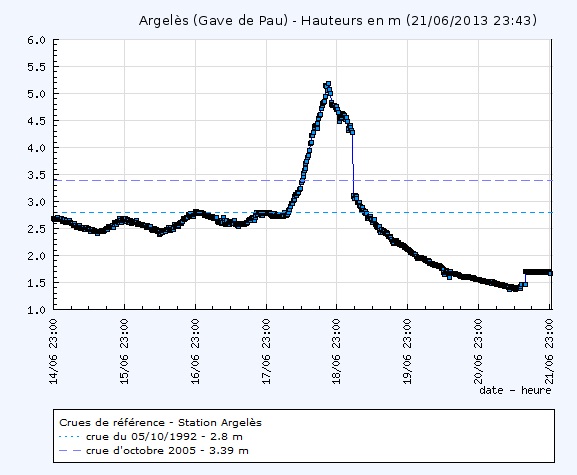
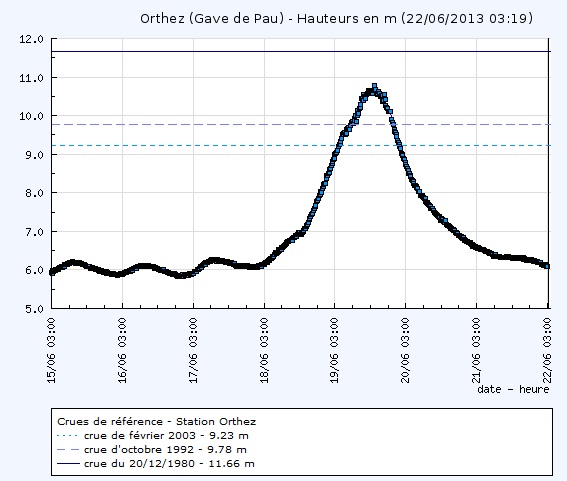
Data from the SCHAPI website show how high water levels rose at several gauging stations. From upstream to downstream in the Gave de Pau river (locations 1 to 6 in the map above), we can see that record levels were reached during this flood event (source: Vigicrues):
- @ Argèles, water levels reached a peak at 5.19 metres on 18 June 20h15. It is 1.8 m above its historic level on Oct 2005.
- @ Lourdes, the situation is very similar: water levels reached a peak at 4.1 metres on 18 June 19h00. It is 1.6 m above its historic level on Oct 1992.

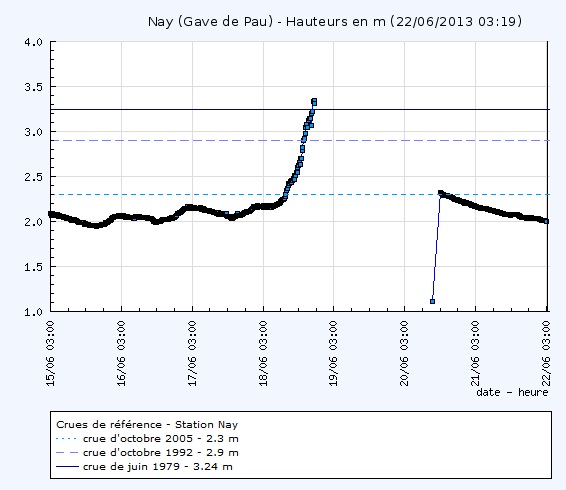
- @ Nay, water levels were measured up to a peak of 3.35 metres on 18 June 20h15. Soon after, data was not available anymore for almost 48h. The historic level at this station was 3.24 m, recorded on Jun 1979.
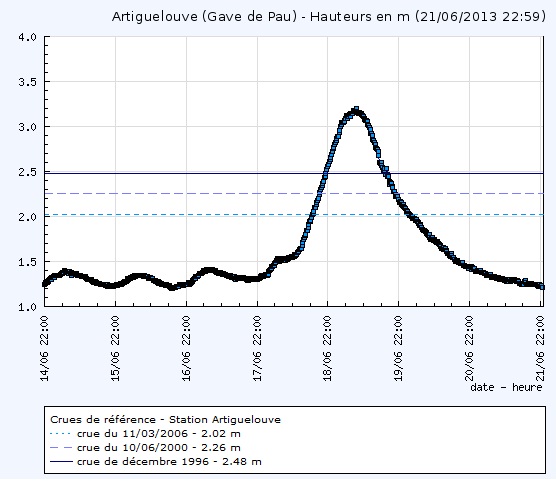
- @ Artiguelouve, with flood propagating downstream, water levels reached a peak at 3.2 metres on 19 June 7h30. It is 0.72 m above its historic level on Dec 1996.
- @ Orthez, water levels did not reach its historic level observed on Dec 1980, but a maximum of 10.79 metres was registered on 19 June 16h15. It is only 0.87 m below the historic level.
- @ Berenx, water levels reached a peak at 8.08 metres on 19 June 16h15. It is 2.18 m above its reference historic level on Oct 1992.
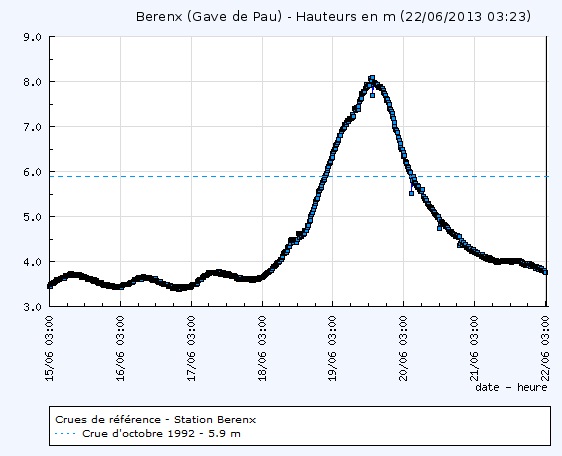
The graphs above give an indication of the severity of the floods and illustrate the importance (and challenges) of hydrological measurements in real-time, as can be seen from the missing data at the gauging stations ‘Lourdes’ and ‘Nay’.
The June 17-19 storms and floods have claimed the lives of three people and a few-months cub was found dead in Parque Natural del Alto Pirineo (Lérida) in the Spanish Pyrenees. Civil protection registered several assistance interventions and about a thousand of people had to be evacuated. Important economic losses are expected, mainly in the Hautes-Pyrenees, as it is estimated that discharges at the Garonne river were above the 100-flood level.
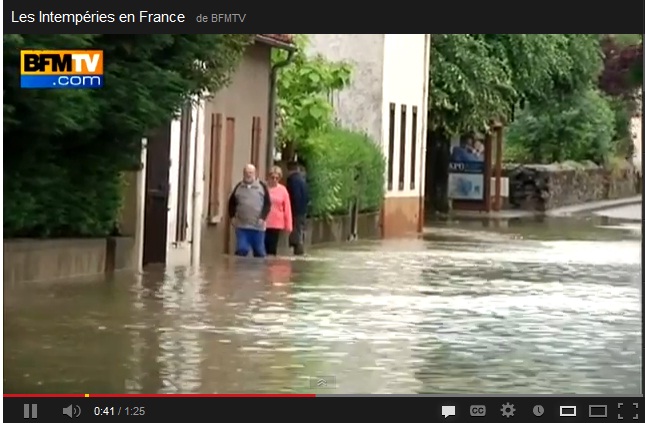
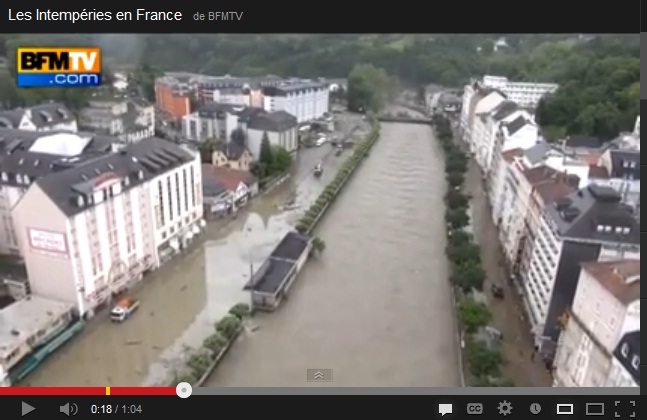
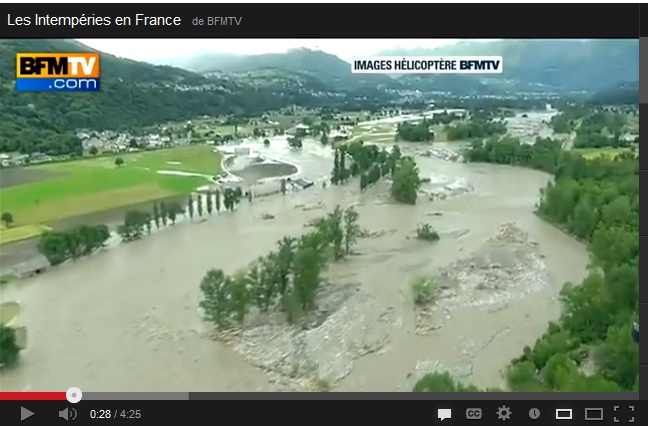
The screen shots below are taken from BFMTV videos made available. They allow to visualise the extent of the flood event.
- This video was published on Jun 18th and shows the floods on the Garonne river.
- This one was published on Jun 19th and shows aerial views of the city of Lourdes, taken from a drone on the same day afternoon. Another one here.
- This video shows images taken by BFMTV helicopter on Wednesday June 19th with views of the flooded areas of Pierrefitte-Nestalas (Hautes-Pyrénées).
During this flood event, residents declared that the water levels in the rivers rose rapidly, in a matter of few hours. Hikers even claimed, when rescued, that releases from hydroelectric power dams were responsible for such a sudden raise of waters, which was denied by the French producer of energy EDF, who formally declared their efforts in facing the exceptional flood situation.
Case-studies are valuable contributions to HEPEX
As other severe flood events in mountainous areas, this episode illustrates the challenges in forecasting, communicating alerts and making decisions on the basis of uncertain hydrometeorological flood events during critical (under-pressure) situations in operational forecasting. The information provided here will certainly evolve with more in-depth analyses that might be carried out in the next months. Nonetheless, the information collected shows that thousands of people were rescued and most certainly a more dramatic situation in terms of human losses was avoided.
For HEPEX, such an event provides also a case-study on how to forecast and deal with flash-flood events in crisis management, raising questions as, for instance, how to improve flash-flood guidance through the use of probabilistic information and hydrological ensemble predictions?
This topic is certainly not a new one, but still deserves attention: see, for instance, studies on uncertainty propagation in the Flash Flood Guidance System (FFGS) of the U.S. National Weather Service (NWS) published in 2006 and 2010, or studies carried out on European river basins with strong orographic effects, published in 2005, 2011 and recently in 2013. Scientific achievements from the HYDRATE European Project (Hydrometeorological Data Resources And Technology for Effective Flash Flood Forecasting, 2006-2010) and data from its flash flood data center are also some of the recent important contributions to the topic.
Documenting case-studies may help us to learn more from our experiences and improve forecasting methods and communication strategies. Many challenges thus for scientists, operational forecasters and decision-makers!
June 26, 2013 at 05:02
Nice description of the event and the efforts of the forecasting and emergency management services (I particularly like the picture of the operations center). I wonder how this event may have been predicted in the probabilistic context (most of the graphics are deterministic) that HEPEX promotes — e.g., perhaps by systems such as EFAS — and whether they played a role in early warning for the national weather and flood prediction services. Was there early indication of the potential for such an extreme event, or is flash flooding such a short-range phenomenon that ensemble approaches in the works to date may not be applicable?
June 26, 2013 at 06:12
That’s an interesting question, Andy. I do not have access to operational forecasts (deterministic or probabilistic) but maybe other readers might have some additional information about any (if any) indication of an upcoming event from an operational (or pre-operational) system. How ensemble predictions can improve preparedness for flash-flood events or provide useful information for emergency management during crisis is certainly an interesting topic within HEPEX. In France, B. Vincendon from GAME/CNRM-Météo France has developed some interesting research works on the topic (see below). What was operationally working during these recent events and how it performed are remaining questions.
– Vincendon, B., V. Ducrocq, O. Nuissier, and B. Vié (2012) Usefulness of radar QPE for Mediterranean flash-flood ensemble forecasting. Available at:http://www.meteo.fr/cic/meetings/2012/ERAD/presentations/thursday/11-2.pdf
– Vincendon, B., V. Ducrocq, O. Nuissier, and B. Vié (2011) Perturbation of convection-permitting NWP forecasts for flash-flood ensemble forecasting. Nat. Hazards Earth Syst. Sci., 11, 1529-1544. http://www.nat-hazards-earth-syst-sci.net/11/1529/2011/nhess-11-1529-2011.html
– Vincendon, B., V. Ducrocq, O. Nuissier, and B. Vié (2011) Benefit of convective-scale meteorological models for Mediterranean flash-floods forecasting. Available at: http://www.imprints-fp7.eu/workshop-toulouse/images/stories/pdf/posters/posters_22_poster_BVincendon.pdf
– Vincendon, B., Ducrocq, V., Nuissier, O., Vié, B., Saulnier, G.-M (2009) Hydrometeorological ensemble forecasting of Mediterranean flash-flood events. EMS Annual Meeting Abstracts: http://meetingorganizer.copernicus.org/EMS2009/EMS2009-52.pdf
June 26, 2013 at 10:34
Very good description of the event, Maria-Helena. From the EFAS side, we had indeed a strong signal detected by EPIC (European Precipitation Index based on simulated Climatology) which exceeded our alert level from the forecast run of 18/6/2013 00 UTC.
An EFAS Flash Flood Watch for the Gave de Pau and the region of Arcachon-Sanguinet was sent on the same day at about 11 CET to the French partners of EFAS, therefore before the river discharge reached warning level at any of the stations showed above in M-H’s post.
Interestingly, despite some snowmelt is mentioned to have contributed to the flood, the forecast precipitation alone was enough to trigger an EFAS flash flood alert. Indeed, EPIC is based only on a statistical comparison between forecast ensemble precipitation integrated over the basin, and a long reforecast dataset.
See more details on the approach in the following publications:
Alfieri, L., Thielen, J., 2012. A European precipitation index for extreme rain-storm and flash flood early warning. Meteorological Applications (online version).
Alfieri, L., Velasco, D., Thielen, J., 2011. Flash flood detection through a multi-stage probabilistic warning system for heavy precipitation events. Advances in Geosciences 69–75.
June 26, 2013 at 16:27
Thanks, Lorenzo. Nice complementary information. Triggering an event like this is certainly not an easy task for a forecasting system. It would be interesting to know how this information was used by the national services and linked to the local forecasts.
Also interesting are the perceptions of the public and experts other than forecasters. An interview published on June 23 [1, in French] illustrates how important it is to place a severe event like this within the history of local floods to develop a risk culture (‘benchmarking’). It also made me think about how accurate a flash-flood forecast can be. In the same interview, one reads: “À Artiguelouve, la prévision était à 2,80 m et on s’est retrouvé avec 3,30 m” [At Artiguelouve, the forecast was at 2,80 m and we had 3,30 m]. I wonder how far forecasters can go with accuracy and how much of uncertainty people are ready to accept.
[1] http://www.sudouest.fr/2013/06/23/le-point-noir-c-est-l-impreparation-1094042-4344.php
June 27, 2013 at 14:31
@Andy
on vigicrues.gouv.fr web site, the graphics only present the measured water levels. And sometimes the associated discharges. During this event, measures were unaccurate, as hightlighted by the level’s break around 5H (local time) at Argelès station. Forecasters mentioned this information below the graph on vigicrues.gouv.fr web site.
Further developments are currently made to provide hydrological forecasts and some regional services start to display the forecasts on their local web site :
http://www3.centre.developpement-durable.gouv.fr/spc-lci/