Forecasting over international borders: limitations and solutions for large-scale or continental forecasting systems
Contributed by Chantal Donnelly (SMHI), member of the SMHI Guest Columnist Team
Global and continental forecasting schemes already exist and are used to inform disaster management in countries without sufficient national forecast systems of their own, as inputs to operational oceanographic models and for the general interest of citizens. I have been lucky enough to have worked with two operational European forecasting systems (setting up of E-HYPE and the WET tool, as an operational EFAS forecaster and testing E-HYPE in EFAS). My colleagues have also just recently set up a forecast system for the Arctic basin, Arctic-HYPE. So, I thought I’d reflect on some of the challenges specific to international forecasting.
Unlike national or subnational forecast systems, which often have access to their own country or region’s collected hydrometeorological data and expertise, international forecasting systems have to do with inhomogenous collations of data from different countries. There can be huge differences in how neighbouring countries contribute to international databases!
Historical collations of daily precipitation and temperature observations are improving, for example the E-OBS product in Europe, but data coverage both in time and space tends to be fairly uneven. Similarly, the global runoff data centre (GRDC) provides a fantastic service in collating and disseminating river discharge data around the world, but again, not all discharge data is available for all periods in this data set either.
So, what are some of the limitations for international forecasting and how can these be solved? Here are just a few:
- There is often no single forcing data set that is consistently better than others. For example, in Europe, variations in precipitation and temperature gauges used in different data sets mean that quality varies regionally (e.g. Fig 1)
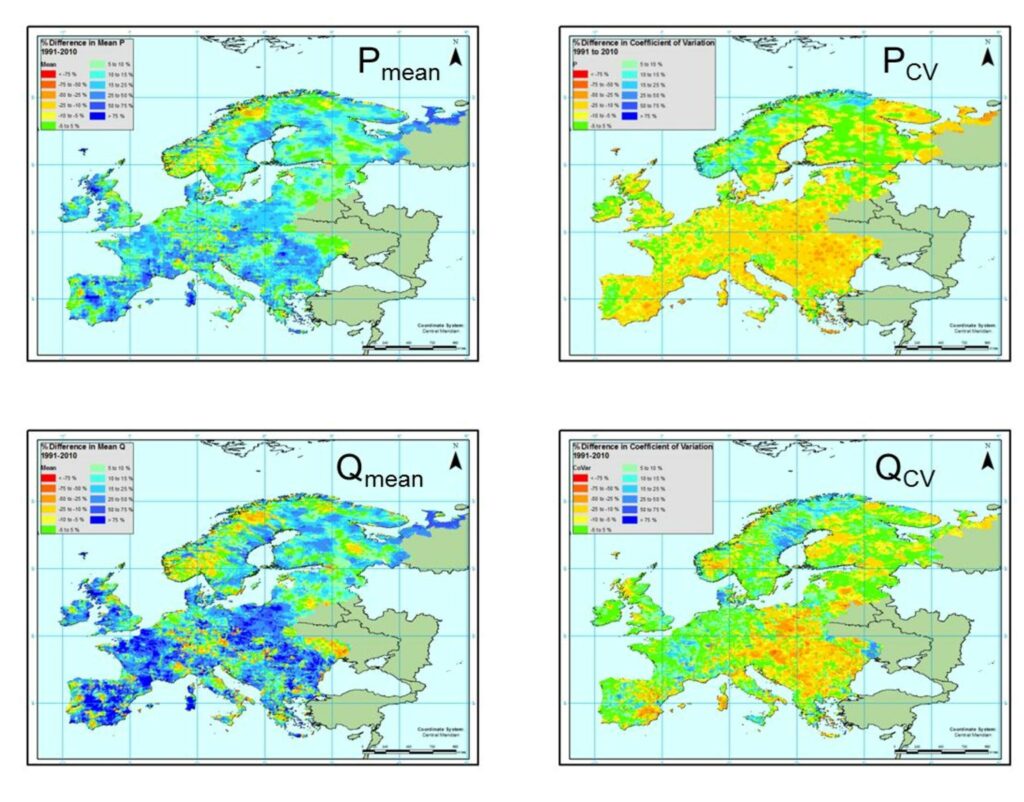
Fig.1. Row 1: Percentage difference between the mean and coefficient of variation of precipitation between gridded observations (5 km) and WFDEI and, Row 2: for discharge simulated using the gridded 5 km observations and WFDEI for the period 1991 to 2010.
- The available historical forcing sets are often only available to a fixed period (e.g. 2013), so can’t be used for hydrological model spin-up and initialisation.
- This leads to a mix of model based forcing (reanalysis/forecast) and observation based forcing (interpolated observations) to calibrate, spin-up/initialise and run forecasts. As a result, potentially 3 or more different forcing sets can be used to make a forecast, e.g. (i) calibration to best available historical forcing, (ii) spin up with reanalysis and/or saved forecasts (iii) forecasting with ensemble or deterministic forecast model.
- Real-time discharge data is generally unavailable for assimilation into the forecast model, so initial states are only as good as the calibrated hydrological model and forcing data.
We have begun testing solutions to these issues in our operational international forecasting at SMHI.
To secure a continuous forcing data set that can continue from an historical reference period until near-real-time, we created GFD (or global forcing data). This in an operational product that can flexibly correct a gridded reanalysis or forecast grid to gridded observations. By flexible we mean that either the gridded model data or observations can be interchanged so that when an historical reanalysis such as ERA-INTERIM is not available (e.g. typically at t-3 months), this can be replaced by saved deterministic forecast data (DFD). GFD corrects both ERA-INTERIM and the saved forecasts to gridded monthly mean precipitation (e.g. GPCC), ensuring continuity of the forcing data set from calibration to model initialisation. We are also now testing to see if we could similarly exploit our knowledge of the biases between forecasts (saved) and best available historical forcing data to correct our meteorological forecasts (e.g. Fig. 2).
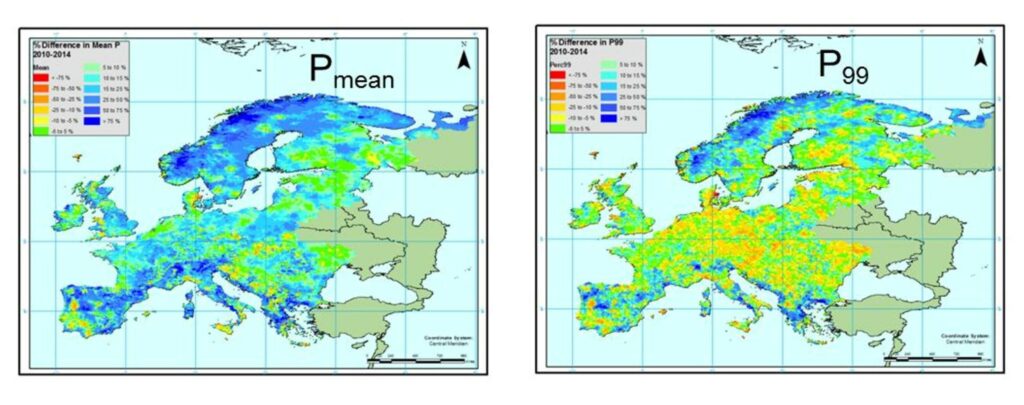
Fig 2. Percentage difference between gridded observations (5 km) and saved deterministic forecasts at the E-HYPE model subbasin scale for the period 2010-2014. Note the large positive biases in the forecast over northern Europe and local negative biases in extremes over most of continental Europe as well as strong local biases for more extreme precipitation events (P99).
This could potentially be useful not only for homogenising input forcing data to international forecast systems, but possibly also for bias-correcting forecasts in all hydrological forecasting systems.
We are also investigating remote sensing solution for model initialisation including altimeter measurements of surface water bodies, and satellite derived snow extent and depths. Our ultimate goal is to make international forecasting more useful despite the limitations that international borders sometimes present!
Examples:
| Calibration | Spin-up | Forecasts | Comments | |
| WET: Water in Europe Today | WFDEI to 2013 | Saved ECMWF deterministic forecasts | ECMWF deterministic forecast | http://riverinfo.eu/
Currently being updated to GFD |
| Arctic-HYPE | GFD | GFD-GPCC first guess + saved ECMWFW det. forecasts corrected to GPCC | ECWF deterministic forecast | http://hypeweb.smhi.se/arctichype/
The spin-up uses 3 different combinations of gridded reanalysis/forecast and gauge data as data becomes online/available |
Read more here.
July 1, 2016 at 02:20
Dear Chantal, nice post. Thanks for it. We have the same issues at South America (SA).
I have a question about politics. Do you consider that some countries politics are also a barrier for large-scale or continental forecasting systems?
Here in SA they are… since some countries do not have hydrological data availability programs.
July 4, 2016 at 15:11
Hi Fernando – absolutely! We can see country borders in many pan-European databases (soil-type, precipitation) simply because the data provided is of different resolution, different quality or different quantity from different countries. Nevertheless, in the 8 years I have worked with Europe, the availablity of data has increased significantly. I therefore expect that the quality of the pan-European databases will increase. Is there a similar explosion of open data in South-America? Which countries in SA have open data policies?