High-resolution flood forecasting in Sweden: a status update
Contributed by Jonas Olsson (SMHI), member of the SMHI Guest Columnist Team
Traditionally, hydrological activities (observations, modelling, forecasting) at SMHI have mainly focused on Sweden’s large rivers. The largest ones are Göta River with a catchment size of ~50 000 km² and Torne River with ~40 000 km² and then there are many (often regulated) with a catchment size of 20 000 to 30 000 km². The HBV model in combination with comparatively coarse-scale geographical and (in time and space) meteorological data has worked excellently for all forecasting purposes.
However, some five years ago technical advances as well as societal needs spawned an initiative to work towards higher-resolution flood forecasting. On one hand the national set-up of the HYPE model (Lindström et al., 2010) – S-HYPE – was under development. In S-HYPE Sweden was initially divided into ~17 000 sub-catchments (mean size ~25 km²), making it possible to work with also small and fast-responding catchments. On the other hand the issue of cloudburst consequences in terms of urban flooding, debris flow, etc., received a growing attention, not least following the severe flooding in Copenhagen in July 2011, which could equally well have hit Sweden. The time step used in simulation and forecasting was 1 day, which meant for example that the potential gain of the high spatial resolution was not realised and that forecasters had limited possibilities to predict and follow fast floods caused by cloudbursts.
So, we decided to start developing S-HYPE (which is today the basis of the forecasting system, now with almost 40 000 sub-catchments) for running at shorter time steps, with 1 hour as a target value. A project proposal was submitted to the Swedish Civil Contingencies Agency (MSB) and it was granted – thank you! – and this project ended last year. In the following I give an overview of the main activities included.
Precipitation forcing data
To run S-HYPE with a 1-hour time step we first of all needed historical meteorological forcing on the national scale with a 1-hour time step and a sufficiently high spatial resolution. This was obtained by starting from radar-observed precipitation from the Baltrad network (http://se.baltrad.eu/) and apply a bias-correction step against gridded station data to ensure bias-free long-term accumulations (Berg et al., 2016). The resulting data set – HIPRAD (HIgh-resolution Precipitation from gauge-adjusted weather RADar) – has a 15-min time step, a 2×2 km² spatial resolution and goes back to 2000.
S-HYPE parameters and calibration
The parameters were divided into three categories: 1) time-step independent, 2) linearly scalable with time step, and 3) requiring re-calibration. An initial calibration was performed for selected catchments that had recently experienced flooding and then a more general optimization was performed for southern Sweden. Figure 1 shows that NSE is generally above 0.7 which we consider quite OK as a start.
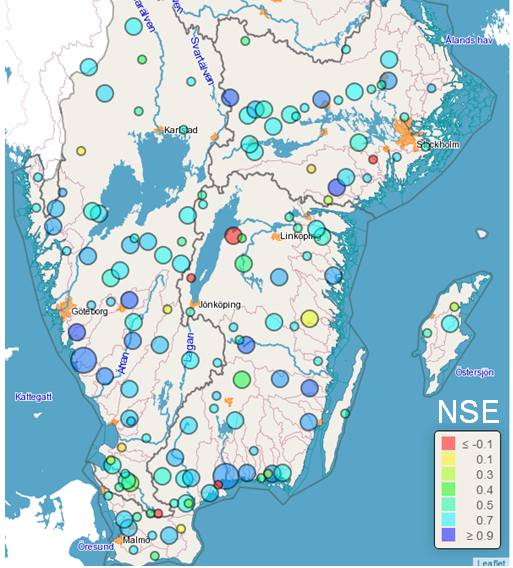
Figure 1. Performance in terms of NSE of the first version of 1-hour S-HYPE in discharge stations in southern Sweden (circle size represents catchment size).
Precipitation forecasts
The development of high-resolution meteorological forecasts is very fast and there is always something better “just around the corner”, which naturally reduces ones motivation to evaluate the existing products. But we made an effort to evaluate nowcasts from SMHIs KNEP system (Ridal et al., 2011) based on the question can a short-duration 10-year rainfall be at all predicted? A total of 48 observed events with a duration between 1 and 24 hours and a mean return period of 10 years were identified, characterised and evaluated (Olsson et al., 2014). As expected predictability was limited, but for short lead times (<3 hours) there were some if allowing some error margin in time (we hydrologists can quite often live with some temporal error) and space (we hate spatial errors).
A lot of further development and evaluation certainly remains but there is now a first version a 1-hour S-HYPE running in pre-operational forecast mode, continuously initialised by a real-time version of HIPRAD and forced with different high-resolution meteorological forecasts. Unfortunately the forecasts are not yet available to the forecasters on duty due to technical complications (always these technical complications…) but we hope to have that solved soon (fortunately this summer was rather cloudburst-free in Sweden).
Finally let me briefly describe some related ongoing activities in order to make everything better in different respects.
Urban areas
In the original, 1-day S-HYPE the description of urban areas is approximate, both in terms of land-use (coming from EEA CORINE) and parameterisation. An improved urban land-use class in HYPE has been developed and more detailed land-use data, for example from the EEA Urban Atlas, is being explored.
Rainfall visualisation
There is clear scope for improving how observed short-duration rainfall is visualised, to support the hydrological forecaster. Currently there is only either hourly values from the station network (Figure 2a), with a lot of unobserved space between the stations, or animated sequences from the radar (Figure 2b), which are very hard to interpret in terms of local accumulations. Figure 2c shows a mock-up of a tool in which catchment-scale accumulations (for a selected historical period/duration) can be visualised in terms of their estimated return period.
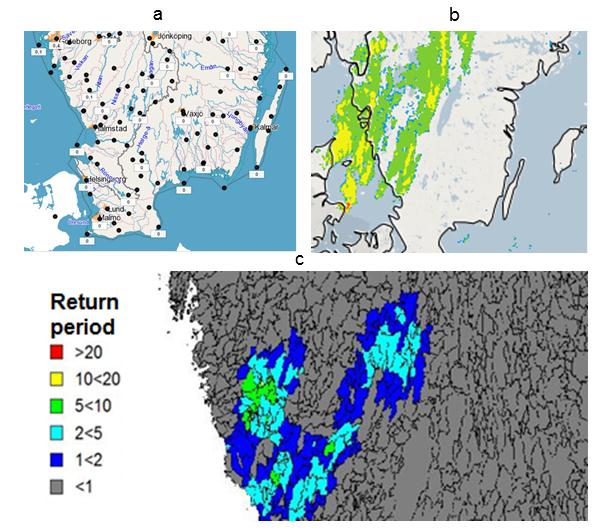
Figure 2. Rainfall observations as visualised using station data (a), radar sequences (b) and in the tool under development (c).
Ensemble forecasts
Of course I cannot write in the HEPEX blog without mentioning ensemble forecasts. We are currently looking at coupling 1-hour S-HYPE with 11-member ensembles (1-hour time steps 36 hours ahead, 2.5×2.5 km² grid) from the HarmonEPS system based on the AROME model (Seity et al., 2010). To practically and meaningfully use these high-resolution ensembles with a national perspective will be a challenge – and we like challenges!
References
Berg, P., Norin, L., and J. Olsson (2016) Creation of a high resolution precipitation data set by merging gridded gauge data and radar observations for Sweden, J. Hydrol., in press, doi:10.1016/j.jhydrol.2015.11.031.
Lindström, G., Pers, C., Rosberg, J., Strömqvist, J., Arheimer, B., 2010. Development and testing of the HYPE (Hydrological Predictions for the Environment) water quality model for different spatial scales. Hydrol. Res., 41, 295–319, doi:10.2166/nh.2010.007
Olsson, J., Simonsson, L., and M. Ridal (2014) Rainfall nowcasting: predictability of short-term extremes in Sweden, Urban Water J., 11, doi: 10.1080/1573062X.2013.847465.
Ridal, M., Lindskog, M., Gustafsson, N., and Haase, G., 2011. Optimized advection of radar reflectivities. Atmospheric Research, 100, 213-225.
Seity, Y., Brousseau, P., Malardel, S., Hello, G., Bénard, P., Bouttier, F., Lac, C., Masson, V., 2011. 631 The AROME-France convective scale operational model. Mon. Weather Rev. 139, 976-999, doi: 632 10.1175/2010MWR3425.1
September 29, 2016 at 21:00
Thanks a lot for the great post! Have you done comparison of HBV and S-HYPE forecasting efficiency in a daily scale? Maybe you have an answer (or assumption) what works best for forecasting: lumped or distributed model (there is no consensus in modeling, but maybe you observed one example in forecasting 🙂 )?
October 5, 2016 at 09:30
Thank you, Georgy! Well, about forecasting in general, as an employee at SMHI have to answer that a semi-distributed approach is preferable (if I wrote something else I would probably get fired :). Further I have too little experience with other approaches to have a credible opinion. About HBV vs. S-HYPE, we have not done much of fully comparable testing but our generally idea is that they can perform equally well for a given catchment, if the same resources are spent on set-up, calibration, etc. The national systems using HBV and HYPE are set up a bit differently, e.g. with real-time station updating in the latter, which makes strict comparison difficult. But Ilias et al. has made a nice evaluation of the systems, including experiences from updating and ensemble forcing, please have a look there for further information: I.G. Pechlivanidis, T. Bosshard, H. Spångmyr, G. Lindström, B. Arheimer, and D. Gustafsson (2014) EPISTEMIC UNCERTAINTY IN THE SWEDISH OPERATIONAL HYDROLOGICAL FORECASTING SYSTEMS, Second International Conference on Vulnerability and Risk Analysis and Management (ICVRAM2014), 13-16 July 2014, University of Liverpool, UK (available upon request).