How can we verify the predictive performance of ensemble hydroclimatic forecasts?
Contributed by Zeqing Huang and Tongtiegang Zhao
This blog aims to contribute to the large scientific discussion on the performance assessment of ensemble hydroclimatic forecasts. We are particularly driven by the valuable global precipitation and temperature forecasts generated by global climate models (GCMs) (Pappenberger and Buizza, 2009; Kirtman et al., 2014; Bauer et al., 2015; Becker et al., 2020; Crochemore et al., 2021). Their forecasts have been widely used in hydrological modeling and water resources management, including flood warning (Alfieri et al., 2013), drought preparation (Yuan et al., 2013) and agricultural water management (Klemm and McPherson, 2017). To facilitate applications of GCM forecasts, it is critical to verify their predictive performances (Murphy, 1993). Through a literature survey, Huang and Zhao (2022) find that there are 20 verification metrics for ensemble, deterministic and categorical forecasts. There are 6 types of diagnostic plots to visualize the relationship between ensemble forecasts and observations. Furthermore, there are 10 attributes of ensemble forecasts in relating them to observations.
Taking the United States National Centers for Environmental Prediction (NCEP) Climate Forecast System version 2 (CFSv2) ensemble precipitation forecasts as an example, six grid cells are selected from the Köppen–Geiger climate classification (Figure 1) to showcase the predictive performance of ensemble forecasts (Figure 2). From Figure 2, it can be observed that ensemble forecasts can exhibit some reasonable correlation with observed precipitation. Meanwhile, the forecasts can be biased, i.e., overall higher (or lower) than observations, and their ensemble spread can be too wide (or too narrow) to capture the observations. The quantile range plots in Figure 2 are effective in illustrating how well ensemble forecasts correspond to observations at the six selected grid cells. Furthermore, as shown in Figure 3, the verification metrics can also be calculated for grid cells around the world and then illustrate the predictive performance at the global scale.
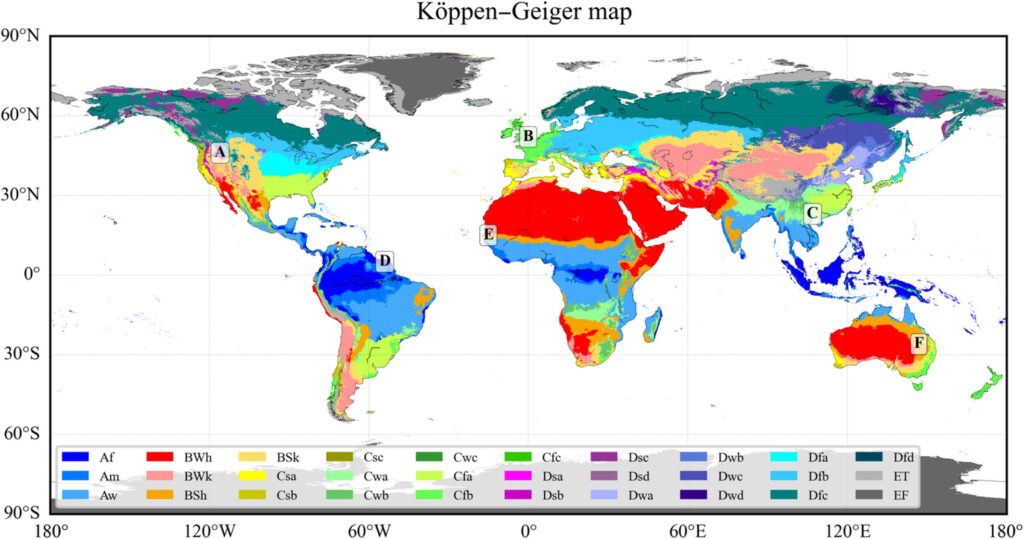
Figure 1. Location map of six selected grid cells in the context of the Köppen–Geiger climate classification (Beck et al., 2018) for the present-day (1980–2016).
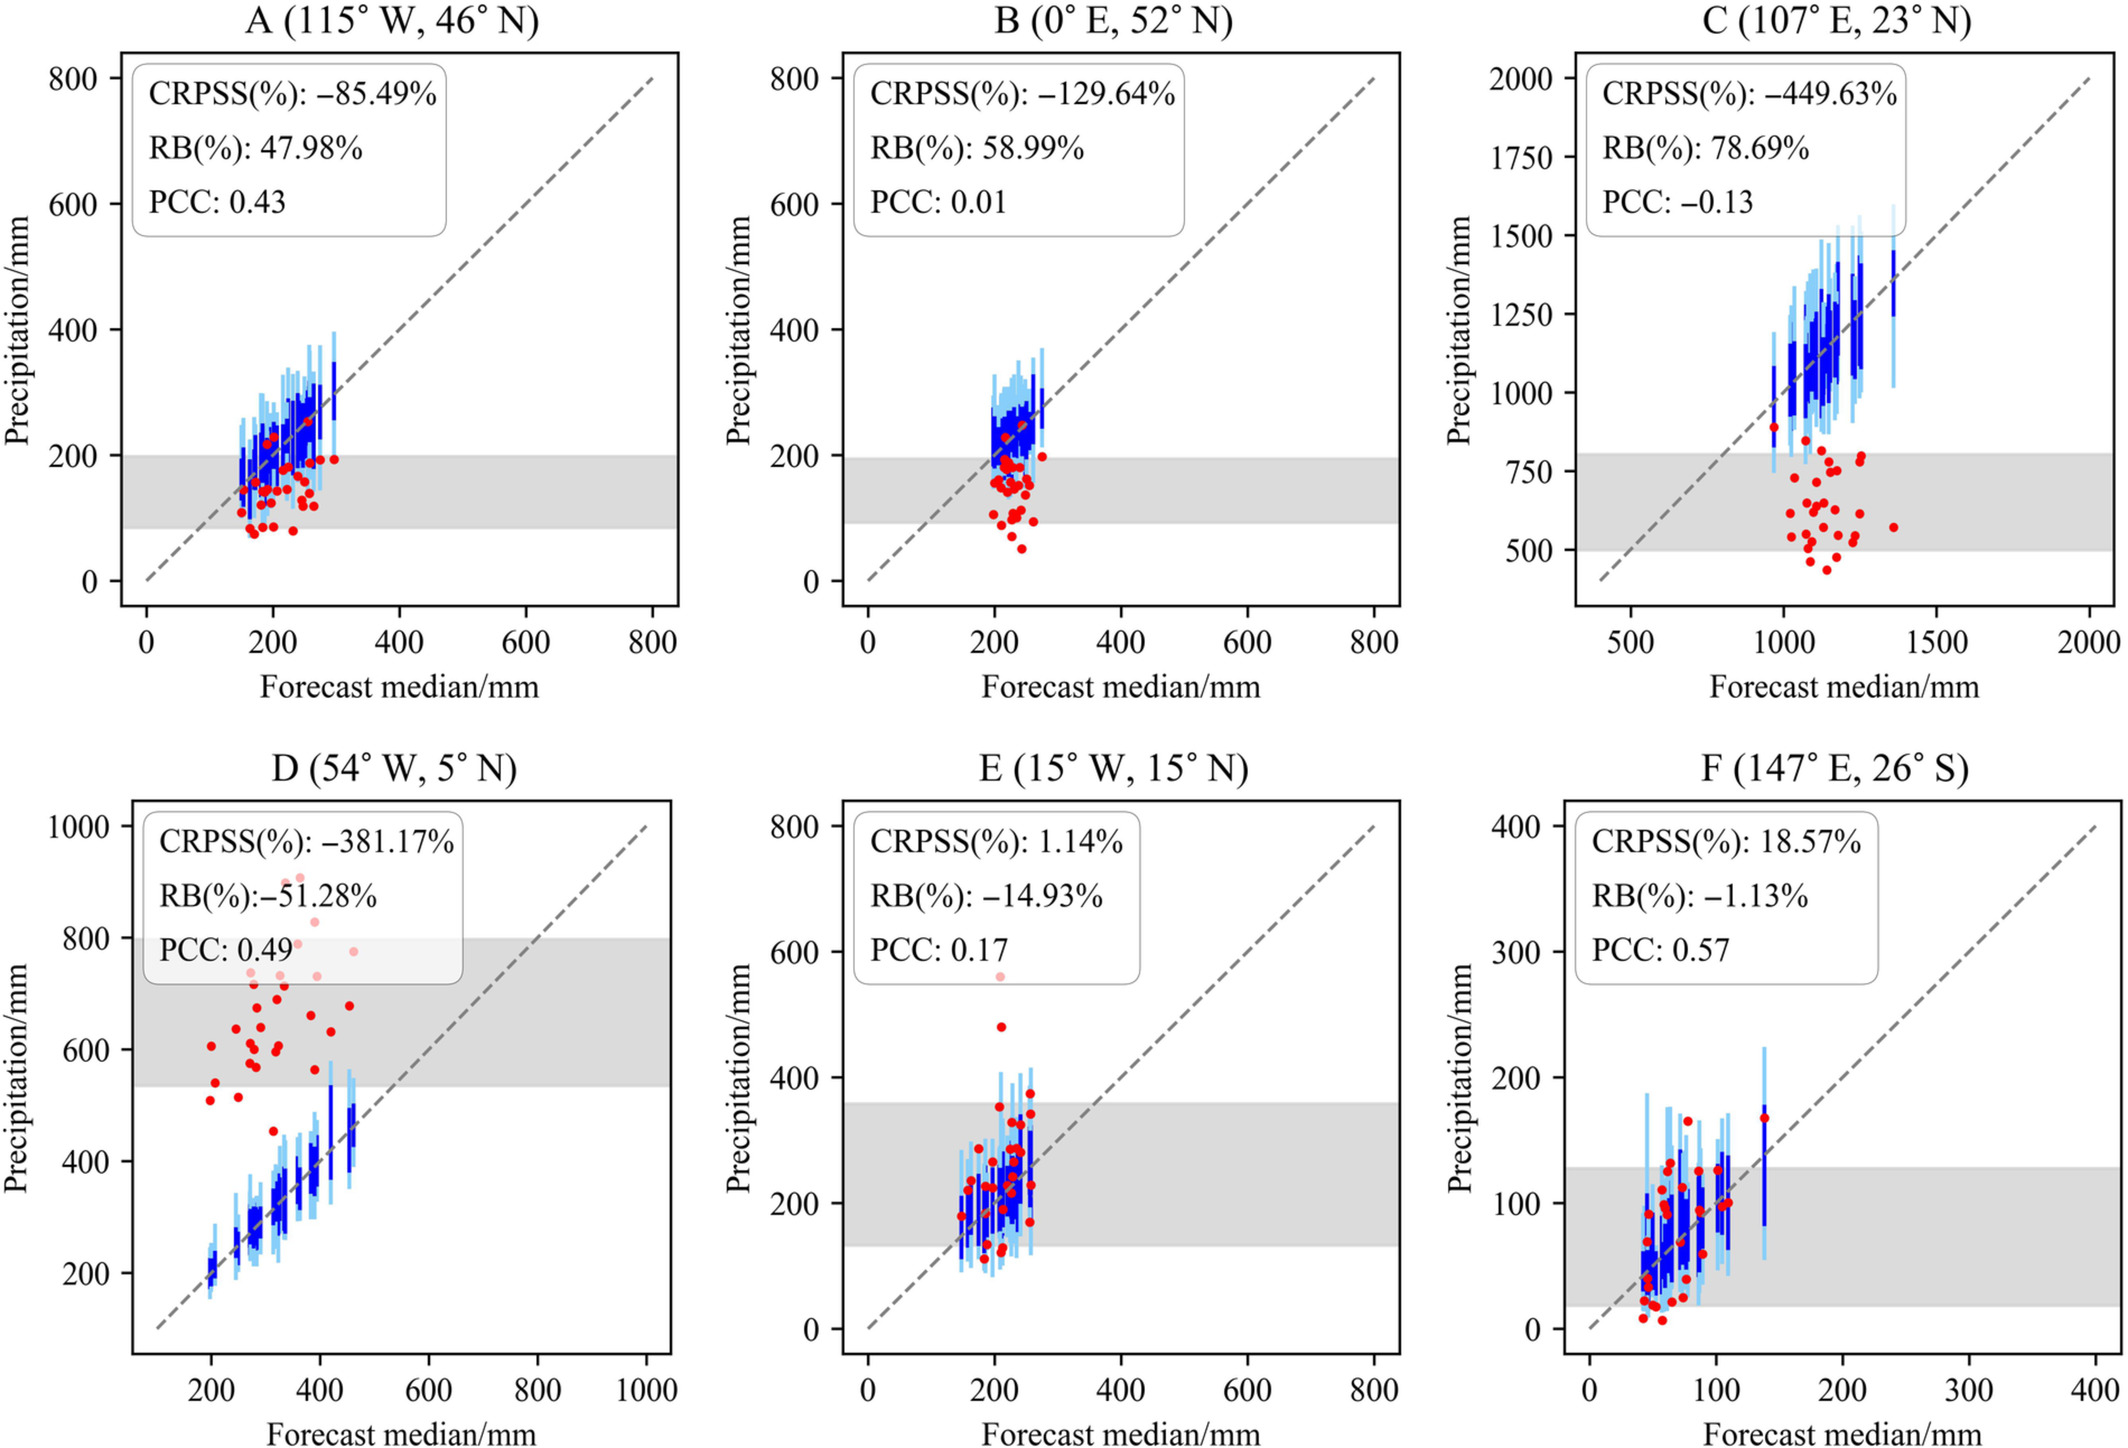
Figure 2. Quantile range plots of ensemble forecasts and their corresponding observations at the six selected grid cells.
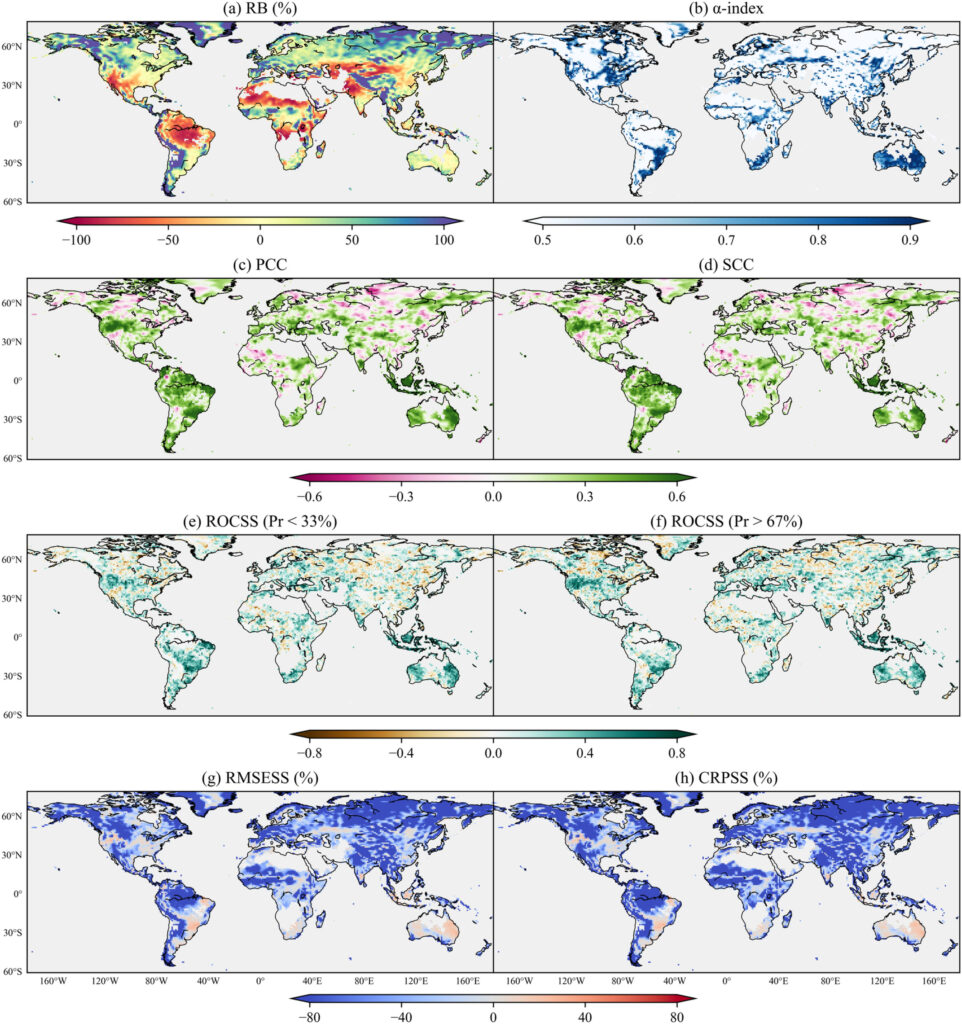
Figure 3. Spatial plots of eight verification metrics for CFSv2 forecasts of global precipitation in June-July-August.
In Huang and Zhao (2022), the relationships of verification metrics and diagnostic plots with forecast attributes are illustrated through numerical experiments of raw CFSv2 ensemble precipitation forecasts. It is anticipated to serve as a roadmap for the selection of verification metrics, diagnostic plots and forecast attributes for the verification of ensemble hydroclimatic forecasts and for the development of forecasting models. If you would like to know more details, check the paper HERE.
0 comments