Is there a difference in meteorological and hydrological forecast practices?
Contributed by Anders Persson, a HEPEX guest columnist for 2014
My previous column featured the severe July 2004 flooding in southern Sweden and how I was brought in to help my hydrological colleagues inform the press. A common question was if the heavy rain had been forecast. My answer was that there had been clear indications several days ahead and a formal warning had been issued a few days before the event.
But a post-mortem investigation complicated the picture: SMHI had issued forecasts along two rather contradictory lines. The meteorologists had more or less verbatim accepted the ECMWF deterministic high-resolution forecasts (HRES). It correctly predicted the rain (both the intensity and the position in the interior of southern Sweden) four days ahead. But the HRES was “jumpy” and next day indicated heavy rainfall far to the northwest close to the Norwegian border and next day far to the southeast near the Baltic Sea (see fig 1). Only the day before did the HRES return to its forecast of heavy rain in the interior of southern Sweden.
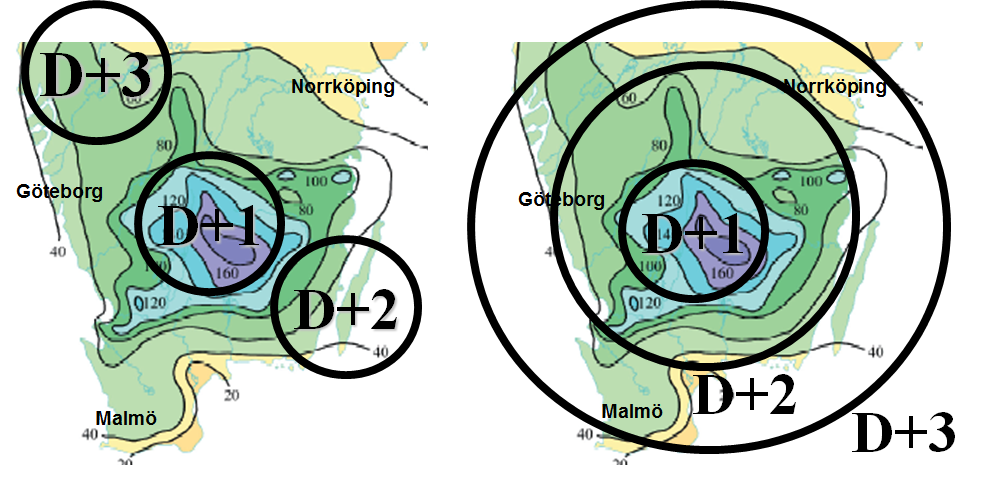
Figure 1. The three last forecasts for excessive rain > 30mm/d valid on the first day of the floodings 9 July 2004. The left figure shows the meteorologists’ forecast, the one on the right was done by the hydrologists.
The meteorologists on duty followed the HRES computer output which four days before the event (9 July, not shown) positioned the heavy rain more or less were it occurred. But the next day’s 3-day forecast the HRES had it far to the NW, the next day far to the SE and only on the day before was the excessive rain put in the right place (Figure 1, left column).
The hydrologists decided to “paint with a broad brush” and initially issued warnings that within 3-4 days there would be heavy rain somewhere in Southern Sweden (Figure 1, right column). Two days before the event they narrowed the rain area to the interior of Southern Sweden and the day before their forecast was more or less identical to the meteorologists’.
Formally this means that half of the meteorologists’ forecasts were “correct”. But due to the forecast “jumpiness” it is difficult to see how anybody could trust these forecasts and, more importantly, base any decisions on them.
The hydrological forecast service took a different approach. Realising, perhaps from discussions with the meteorologists and/or the spread of the ensemble forecasts that the situation was not very predictable, their forecasts four days in advance warned about heavy rain somewhere in Southern Sweden. This forecast was only marginally altered the next day. Two days in advance they shrunk the possible target area to central parts of Southern Sweden and then, the day before the rain started, they issued more or less the same forecast as the meteorologists.
The hydrologists’ first three forecasts were not as detailed as their meteorological colleagues’. They took the line to only state what they were certain about and then, as the certainty grew, slowly “zoomed” the forecast into the correct target area.
We can argue whether their forecast was “better” than the meteorologists or not. However, their forecasts gave an impression of consistency which the meteorological forecasts surely lacked. I can imagine that the responsible water authorities therefore felt they could trust these forecasts more than those which rather “jumped around”.
If this had been an isolated case of misjudgement in Sweden in July 2004, we could leave it at that. But in my experience from around the world, or at least Europe, is that this culture of overconfident detailed forecasting has been a general meteorological forecast practice for more than 30 years, more or less since the start of ECMWF – which might not be a coincidence…

Figure 2. Flooding of Lake Finjasjön in Winter 2002. Source: SMHI’s image archive. Photographer: Gunn Persson
On numerous training courses I have recommended meteorological forecasters not to blindly accept the less predictable details in the deterministic output from the HRES.
I have showed them theoretically and practically that ignoring or smoothing out small and therefore less predictable scales in the HRES would not only highly improve their performance in relation to the computer generated output, their forecasts would also, as “an extra bonus”, be much less “jumpy” and appear more reliable.
But the meteorological forecasters were not keen to follow my “less is better” advice. I have never understood why, in particular since “beating the computer” was high on the agenda for many of them. Some claimed that they wanted to maintain details to make their forecast appear “meteorologically realistic”, others seemed be happy to follow the HRES and take the credit when it was right and blame it when it was wrong [1].
But shouldn’t I take comfort in the fact that at least the SMHI hydrologists had followed my “less is better” advice?
-But I never told them! The hydrologists never attended the meteorological courses. They came up with this clever solution on their own!
Next post: 23 May 2014.
 Anders will be contributing to this blog over the year. Follow his columns here.
[1] The legendary Danish forecaster Steffen Hartby is one of the few who has publicly criticised this attitude which he considered undermined the standing of the weather forecast community. For those who can read Scandinavian languages, see his article “Vil du virkelig være meteorolog?” (Do you really want to become a meteorologist?) in “Vejret” published by the Danish Meteorological Society, 2004:4 pages 15-17.
March 21, 2014 at 15:12
Interesting article, Anders. I see that the max observed precipitation was around 160 mm. But I don’t know if I understood it correctly: the column seems to indicate that 30 mm/day is considered “excessive” rain? The implication would be that there would be warnings issued.
March 21, 2014 at 19:31
It is 10 years ago, but if I remember correctly the 160 mm (and the whole background map) refer to the accumulated rainfall 9-12 July. The circles just schematically indicate where the maximum rain was predicted to fall on the first day. 30 mm might perhaps not be “excessive” rain but since the ground was quite saturated before the event (if I remember correctly) it would at least be justified to categorize it as “high impact” rainfall.
March 24, 2014 at 12:48
A nice article Anders. As part of a project that has interviewed forecasters at the UK Met Office and shadowed their shifts, I think the Met Office in the UK is quite good at not giving an unwarranted amount of precision in the spatial location of its weather warnings. See, e.g. here. I can’t vouch for how it would have been back in 2004, but certainly now I believe it would take the approach of the hydrological forecasters, and reflect the model jumpiness by issuing a yellow or amber forecast for a whole region rather than a red forecast in a more localised area. Of course this would be accompanied by detailed verbal and written guidance that would state that the colouring of the warning area reflected the uncertainty in the location of the rainfall.
In terms of the hydrological forecasting in the UK, at longer lead times any advanced warning is issued over larger areas than just a single catchment. The public don’t have access to any warnings more than 3 days in advance, and at 3 days it would only be a county-wide ‘heads up’. I guess this is a reflection of the spatial uncertainty in the forecast at longer lead times.
It would perhaps be useful to characterise what spatial uncertainty different users of hydrological forecasts can accommodate at different lead times. This information could then be used to understand which forecast is better.
March 24, 2014 at 22:54
You are right and I think the UK Met Office good warnings practice is shared by most other European met services, at least from what can be seen at the Meteoalarm site http://www.meteoalarm.eu/
However, there is a problem – the automated high-resolution output on the web, in the UK called the “post code weather forecast”, in other countries something else.
Being more or less raw output from a deterministic high-resolution NWP model these forecasts give a misleading illusion of high accuracy. This illusion of high confidence is countered by frequent “forecast jumps” from one solution to another within 6 or 12 hours. And, connecting to your comment, these “post code weather forecasts” will, as far as I know, not necessarily be consistent with the official warnings.
March 25, 2014 at 10:27
. . .when I came to think about it, there have been different practices also on Meteoralarm. Last autumn during a severe storm over Kattegatt one neighbouring country (A) chose to base their warnings verbatim on the computer. Some parts of their area were coloured green, others yellow and some red. Neighbouring country (B) had red all over the place, clearly deviating from the computer output.
The observed winds corresponded to green, yellow and red, although not exactly where A had put them. Still I am sure a statistical verification would have shown A’s warnings clearly better than B’s which clearly over forecast the event.
But while the authorities in A were very critical with the warnings they received the authorities in B were quite pleased. The reason was that the meteorologists in A had applied the same norm as the statistical verification, that “false alarms” are as bad as “missed events”.
The meteorologists in B, however, in my view correctly, worked from the principle that if you have to issue deterministic forecasts of an extreme event it is much better for the public and customers to minimize the “missed events” even if it increases the “false alarms”.
All these problems are of course resolved if the warnings are formulated probabilistically, but that is another story.
March 27, 2014 at 15:54
I think the issue of anchoring bias is quite a wide spread “problem” – also in hydrology, despite the example above. Cognitive psychologists call this an ‘anchoring bias’, whereby a single piece of information provides the central reference point, or anchor, around which the perception of other sources of information is then adjusted. David Demeritt and Sebastien Norbert (see link below) have written some nice papers about this. One way out is better training and education.
However, I also wonder whether the people who design the forecasting systems have to be held responsible. The maps start to look more and more precise and you can click on any point to get detailed time series about this point. This zooming contributes false certainty. Rarely, the system design as similar functions when you zoom out – it may make the picture more coarse grain, but it does not automatically aggregate to meaningful units. So when you zoom out of your forecast, then why not have an automatic aggregation to catchments? Or even better do not allow a zooming level which gives an impression of unrealistic precision?
DD publications (check for the once on flooding and forecasting)
http://www.kcl.ac.uk/sspp/departments/geography/people/academic/demeritt/Publications.aspx
March 27, 2014 at 22:22
Concerning over-confident and over-detailed forecasts I think were are dealing with an unholy alliance between meteorologists who wish to impress the rest of the world with detailed and beautifully looking images of the atmosphere, and customers, who wish to hand over the responsibility of decision making to the meteorologists, or rather to these very confidently looking computer models. If a grid point , just NE of Sheffield, predicts 4.3 mm rain in +132 to +138 hours time, who can have anything to say against that?
March 31, 2014 at 07:33
I sense two conflicting objectives here (which Anders addresses in his other columns as well): should the forecast be probabilistically reliable or physically realistic?
The weather forecaster’s view (the left side of figure 1) has the advantage that it “looks like rain” both in its intensity and area coverage, it’s just that the location is wrong.
The hydrologist’s view (right side, figure 1) captures the uncertainty in the location. But you imagine another user who is concerned with another variable, such as area coverage. I don’t know any users like that, but let’s pretend that the emergency manager is trying to decide if he needs 10 light teams to respond to small events in many places or 2 heavy teams to respond to isolated but intense flooding. To them, the hydrologist’s view of light rain smeared everywhere is not very good.
Of course this comes down to the idea of trying to make a probabilistic forecast into a deterministic scenario. Instead, that emergency manager should be looking at 15 maps of ensembles with centers of action all around the place. Or if area coverage is the variable of interest, that should be predicted directly, and instead not try to make the map satisfy all kinds of uses.
Perhaps ensembles aren’t available. I’ve recently heard about this “fuzzy jiggling” that the Met Office does where they take deterministic model output and “shake” the forecast field spatially in many random realizations, using historical displacement errors from past forecasts. Maybe that can help.
March 31, 2014 at 14:48
I would like to broaden Tom’s question to “Do forecasts have to by physically realistic at all?”
Meteorologists at the Marine Forecasting Unit at SMHI have to advice ships leaving Gothenburg for the US east coast if they should pass north of Scotland or through the English Channel. When, on rare occasions, they are uncertain they direct the ships towards Newcastle on the English east coast, half way between the two “physically realistic” routes.
Does the meteorologist want to send the ships, on this very “physically unrealistic” route, to get wrecked in Newcastle harbour? Of course not, the skippers are advised to take that course to await forecast updates. It is on average less costly to make a moderate change from this “middle route” than on half of the time make very long changes.
If the marine meteorologists had been engaged in some “Game Show” they would of course have settled for one or the other route, but now they are involved in helping people making optimal decisions and then other rules apply.