Using ensemble forecasts to inform risk-based operations of a reservoir in Northern California
Contributed by: Chris Delaney, Sonoma County Water Agency; John Mendoza, Sonoma County Water Agency; Brett Whitin, California Nevada River Forecast Center; Rob Hartman, Consultant
Lake Mendocino is a reservoir located in Mendocino County, California, about 110 miles north of the City of San Francisco. This small 144 million cubic meter reservoir (Figure 1) releases water into the Russian River and provides both flood protection and water supply to downstream communities. Lake Mendocino is cooperatively managed by 2 government offices: the federal U.S. Army Corps of Engineers manages flood operations and the Sonoma County Water Agency manages water supply operations. The lake receives inflow from natural runoff as well from an adjacent river system, the Eel River, through a hydroelectric facility (Potter Valley Project) a short distance upstream of the lake. Recent changes in the operations of this hydroelectric facility have drastically reduced the average annual inflow of Lake Mendocino by 45%, contributing to a water supply crisis for the region. This crisis, among other reasons, made Lake Mendocino an ideal location to evaluate forecast based operations in an effort to recover lost water supply reliability, thus Lake Mendocino was selected as a pilot location for the Forecast Informed Reservoir Operations (FIRO) program. FIRO is led by a number of federal, state and local agencies including the U.S. Army Corps of Engineers San Francisco District (‘Corps’), Sonoma County Water Agency (SCWA), National Oceanic and Atmospheric Association (NOAA), and the Center for Western Weather and Water Extremes (CW3E) at Scripps Institute.
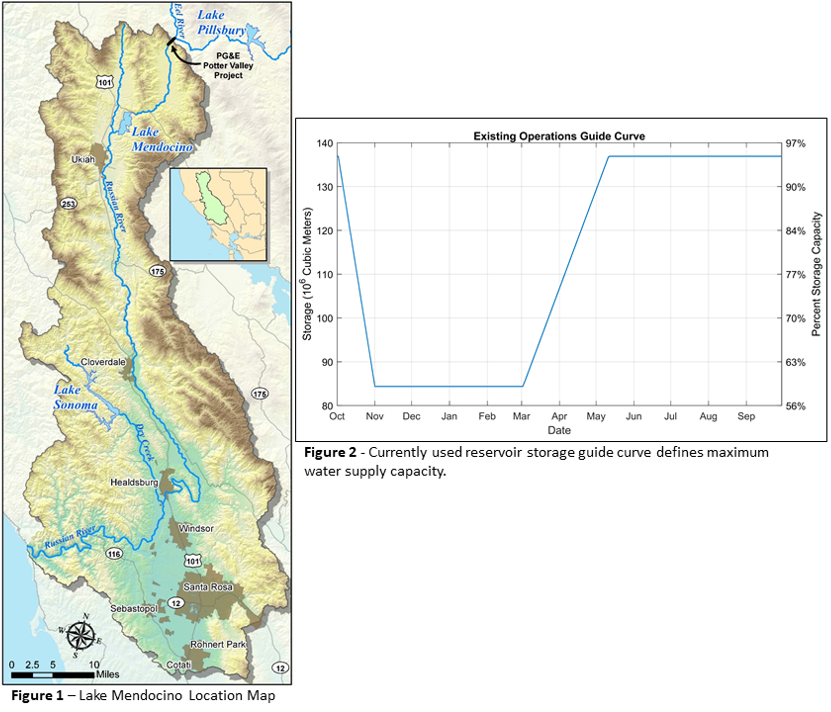
The primary goal of this pilot is to evaluate whether forecasts can be used to inform flood operations to improve the water supply capture of Lake Mendocino without increasing flood risk to downstream communities. So why would changing reservoir flood operations improve water supply? The primary reason relates to a currently used operational rule called the storage guide curve (Figure 2), which determines the maximum water supply storage level of the reservoir. This seasonally varying guide provides increased flood capacity in the wet months (November – February) and increased water supply capacity during the dry months (May – September).
This design works well during years with sufficient springtime (March – May) rainfall to fill the reservoir as the guide curve increases, but dry spring years can be challenging for water supply because the region typically receives very little precipitation during the summer and fall. Under FIRO, the objective is to detain wet season runoff above the guide curve level until forecasts indicate water should be evacuated to provide adequate volume for predicted flood events. Stored water released in advance of a forecasted flood event would be recovered by inflows from the flood event and held in the reservoir for water supply.
Another reason that Lake Mendocino is an ideal location for the FIRO pilot is that the NOAA California Nevada River Forecast Center (CNRFC) currently prepares hydrologic forecasts of reservoir inflows and for points downstream. A key forecast product is an ensemble forecast produced with the Hydrologic Ensemble Forecast System (HEFS), which generates a 59-member ensemble with an hourly timestep up to the 15-day forecast horizon, transitioning to a daily timestep for the 16 to 365 day forecast horizon.
A central challenge for this project is to develop new operational methodologies that incorporate forecast information to make reservoir release decisions to meet the project goals. One such methodology that is being evaluated for Lake Mendocino is called Ensemble Forecast Operations (EFO), which was developed by an engineer at the Sonoma County Water Agency, Chris Delaney (that’s me). I originally developed a simple proof-of-concept model, which I have refined with the help of my colleague and fellow engineer, John Mendoza. This methodology uses the HEFS ensemble forecast prepared by the CNRFC to evaluate the risk of reaching the maximum reservoir storage level. We want to avoid going above this maximum level because this would increase the risk of uncontrolled spillway releases and could flood downstream communities.
The way the EFO methodology works is quite straightforward. Each hydrologic ensemble member is independently modeled to forecast reservoir storage assuming no water is released. Forecasted risk is evaluated for each timestep in the forecast horizon as the percentage of ensemble member that exceed the maximum storage level (137 million cubic meters). The top panel of Figure 3 provides an example of a storage forecast with a 15-day forecast horizon and the maximum storage level shown as the black dashed line. The bottom panel of Figure 3 provides an example of the risk forecast shown as the red line. A key component of the EFO methodology is something called the risk tolerance curve, which is shown in the bottom panel as the blue dashed line. This curve defines the maximum allowable risk for each forecast timestep.
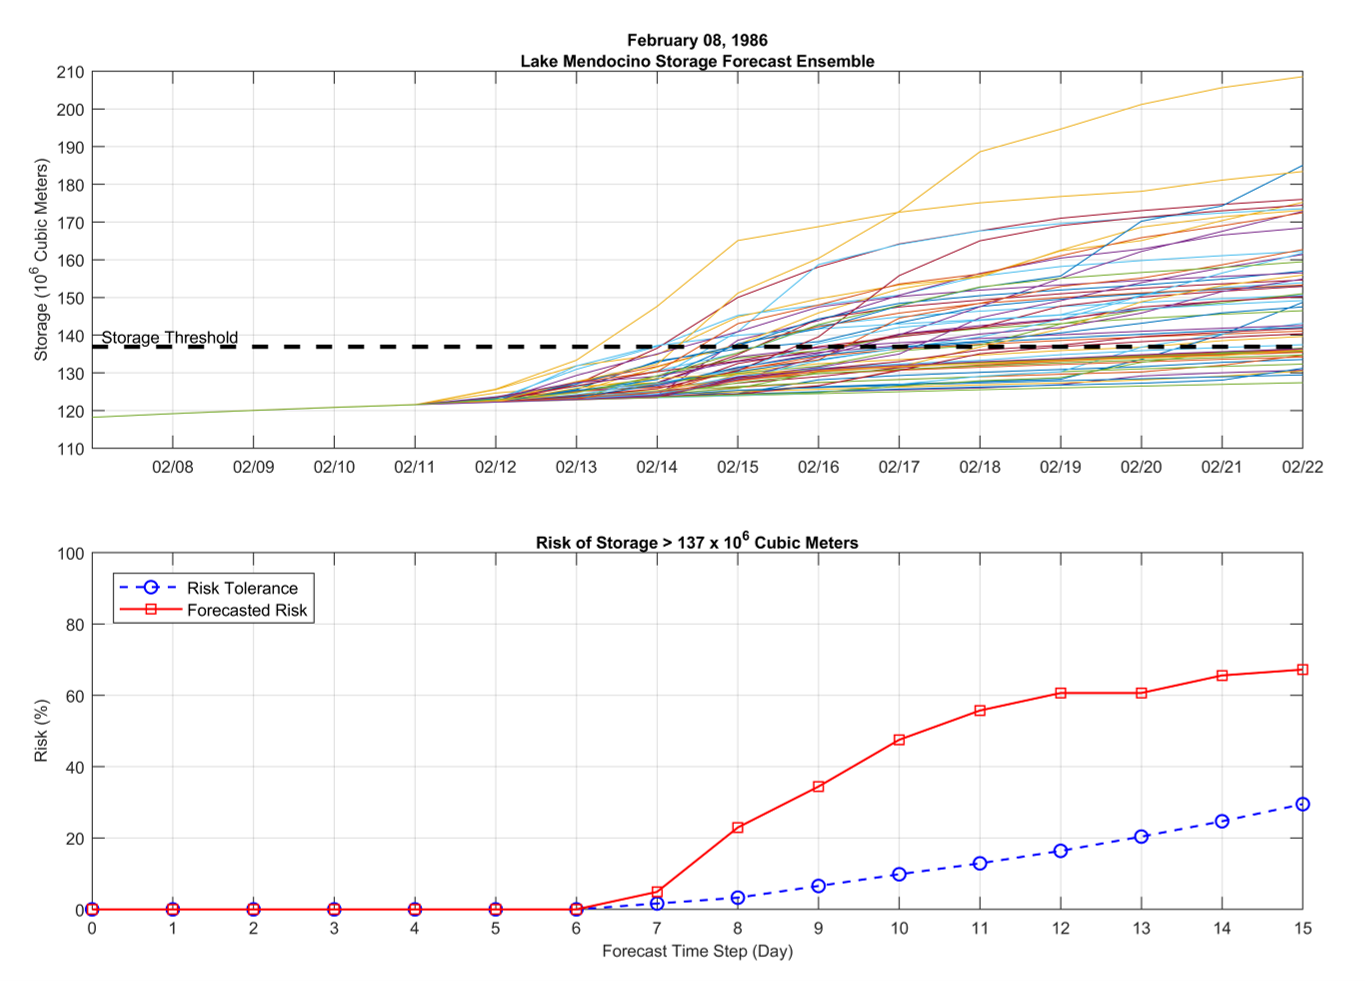
Figure 3 – (top) Storage forecast ensemble assuming zero releases; (bottom) risk of exceeding storage threshold, and operational risk tolerance level.
If forecasted risk exceeds the risk tolerance curve, as in our example, a release schedule is developed that mitigates the forecasted risk at or below the curve. For this example, the model simulated a release of 56 cubic meters per second to reduce the forecasted risk to the risk tolerance level. This is illustrated in the Figure 4 showing forecasted risk and storage levels after the release schedule has been applied. The model completes this process, updating release schedules each day as a new forecast is issued by the CNRFC.
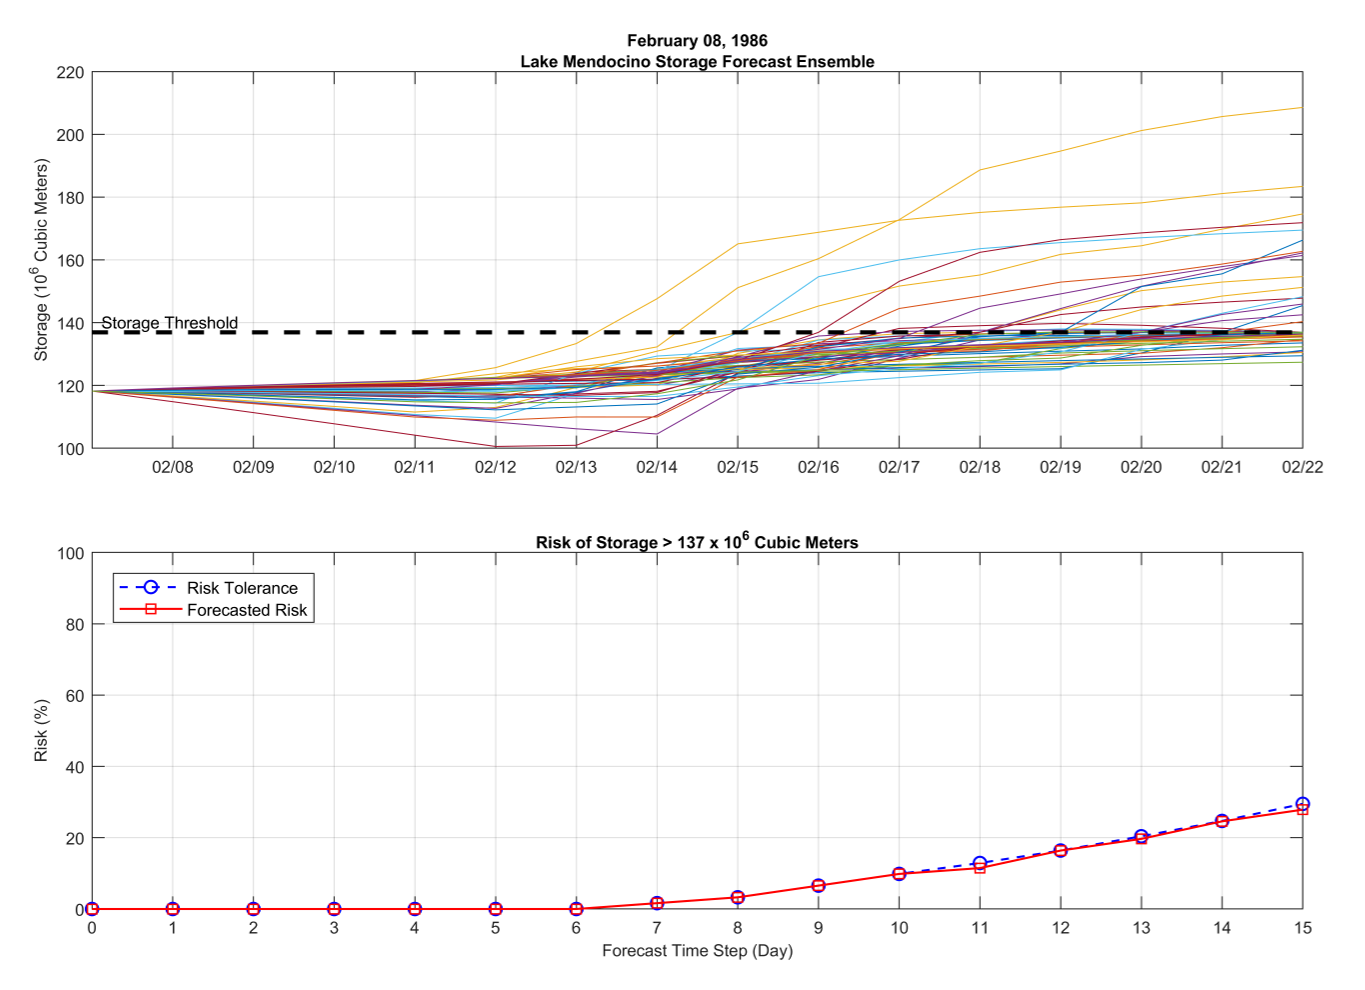
Figure 4 – (top) Storage forecast ensemble after reservoir release schedules are calculated; (bottom) the resulting risk of exceeding the storage threshold matches the EFO risk tolerance policy.
It is important to note that a thorough analysis of the EFO methodology was made possible by a ensemble inflow hindcast dataset from the HEFS prepared by CNRFC for the Russian River Basin. The hindcast study allowed estimating what the forecast would have been for each day from 1985 to 2010, given their current forecasting skill. This allowed us to simulate reservoir operations and flows for points downstream under a variety of hydrologic conditions including the 1986 flood of record. Results show significant increases in storage levels (Figure 5) for almost the entire simulation period, with a 35% increase in median end of water year (September 30) storage levels compared to simulated existing operations.
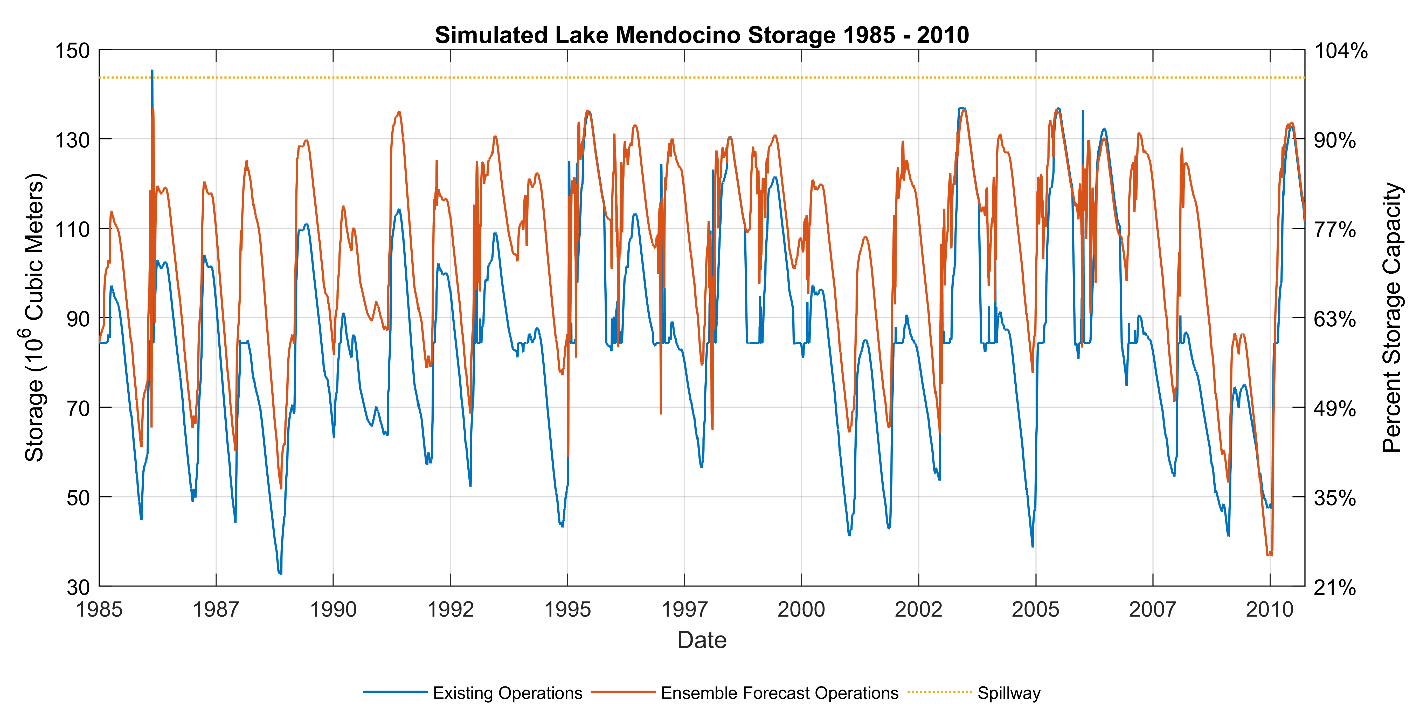
Figure 5 – Storage levels with and without ensemble forecast operations (EFO)
Despite the generally increased storages, hindcast simulation results do not demonstrate any increased flood risk, with no instances of increased flow levels above flood stage. Figure 6 shows flows plotted as percent exceedance for the most flood prone region immediately downstream of Lake Mendocino.
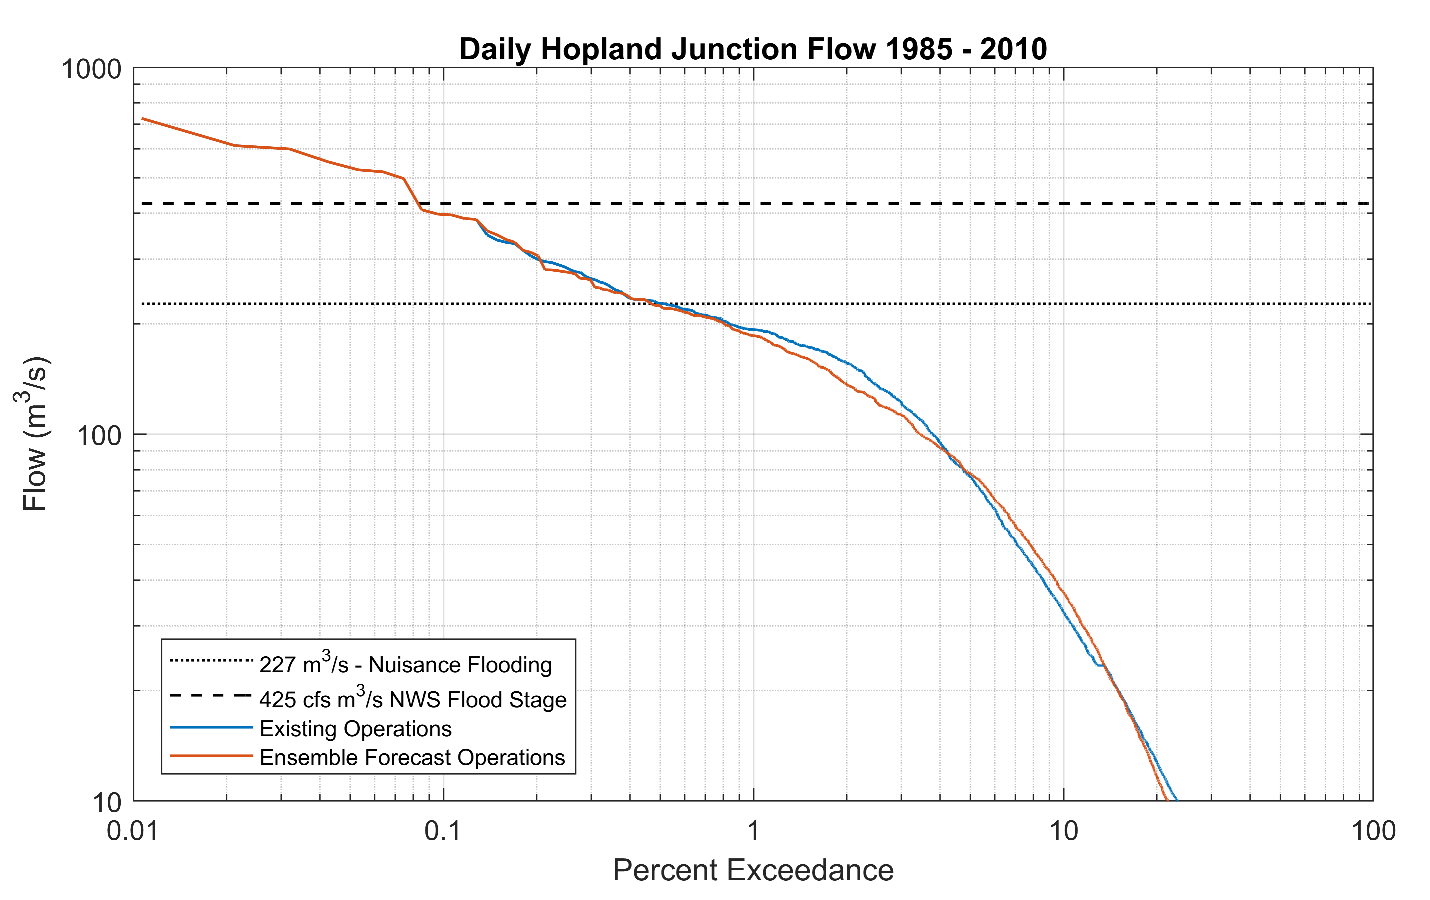
Figure 6 – The distribution of downstream flows with current and EFO operations, showing that no significant increase in the risk of downstream flood-level flows with EFO.
The results of this study demonstrate that the implementation of the EFO methodology will likely achieve the goals of the FIRO Lake Mendocino pilot project – to improve water supply reliability without increasing flood risk to downstream communities. A more complete description of this study included in the Preliminary Viability Assessment Lake Mendocino Forecast Informed Reservoir Operations prepared by the FIRO Steering Committee in 2017. Following these positive outcomes, the Steering Committee is also working with the Corps to implement a revised version of the EFO methodology on an interim trial basis. For more information on FIRO and progress of the Lake Mendocino pilot project please visit the CW3E FIRO website.
We welcome comments and questions from the HEPEX community!
Additional author info: Jay Jasperse of the Sonoma County Water Agency and Marty Ralph of CW3E serve as co-chairs for the Lake Mendocino FIRO program. Rob Hartman is the former chief of the NWS California Nevada River Forecast Center, and has been a long-time contributor to HEPEX. Chris Delaney can be reached with questions and feedback at: Chris.Delaney /at/ scwa.ca.gov
April 11, 2018 at 10:59
Dear Author, please be aware that if ensemble members are not generated through the appropriate conditional predictive densities are inadequate to correctly represent the uncertainty of future outcomes. They tend to be under-dispersed. Please see: Todini E. (2017). Flood Forecasting and Decision Making in the new Millennium. Where are We?, Water Resour Manage, doi:10.1007/s11269-017-1693-7, pp.1-19. +Todini E. (2017). Erratum to Flood Forecasting and Decision Making in the new Millennium. Where are We?, Water Resources Management, 31(13):4371-4372. DOI: 10.1007/s11269-017-1755-x
(which I can directly forward to you if I receive an e-mail address)
April 11, 2018 at 18:30
Hi Ezio, It’s true that having properly conditioned densities (eg statistically reliable ens. forecasts) is an ideal objective, though as we know, very challenging … and maybe even impossible in practice, given the difficulty of conditioning on all possible relevant factors & predictability regimes in systems/watersheds that change over time, and are inadequately observed. In this particular case, the concept of ensemble calibration and conditioning is addressed to some extent through techniques such as the EPP/MEFP and EnsPost that are embedded in HEFS … thanks to the work of people like John Schaake and Rob Hartman, and discussions through HEPEX over the years (in which you’ve also helpfully contributed). Of course, nothing is perfect and there’s always room for more creative and pragmatic solutions in this area. Cheers, Andy
April 11, 2018 at 20:33
Hi Ezio, thanks for reading the article and providing feedback. I would be very interested in the articles you have cited. If you could please send them to me, my e-mail address is chris.delaney@scwa.ca.gov. Also the potential under dispersion of the ensembles might be somewhat mitigated through the risk tolerance curve. Please refer to figure 3, which shows the risk tolerance curve in the bottom panel as the blue dashed line. The first 6 days of the curve are defined with a zero percent risk tolerance, therefore the model will respond to the most conservative storage ensemble member within the 6-day forecast horizon. There is the risk that the most conservative ensemble member does not bound the uncertainty of the forecast, but when compared to current operational practices of managing to a static storage guide curve, the modeling completed to date does not demonstrate an increased flood risk downstream. The study described in this article was completed for a Preliminary Viability Assessment and does not represent a complete analysis of the Ensemble Forecast Operations approach. We are now pursuing a Full Viability Assessment that will include a more thorough analysis of potential flood risks. Thanks again for the interest and please let me know if you have any further comments or questions. Best, Chris