Using the Web for Environmental Big Data
Contributed by Claudia Vitolo and Wouter Buytaert (Civil and Environmental Engineering, Imperial College London)
About 90% of all the data in the world has been generated over the last two years1. At this rate, in 2015 we are expected to deal with 7.9 ZB (1 ZB = 1012 GB) of data, increasing to 35 ZB in the next five years2. A considerable share of these Big Data is the result of environmental related activities3,4 via computer simulation, as well as in-situ monitoring, remote sensing, citizen science projects5 and more specialized channels, such as data feeds from internet-enabled objects and online social networks.
[read more=”Read more” less=”Read less”]
Environmental Big Data (EBD) are therefore abundant, but also heterogeneous by nature. The variety of information types spans a wide range of data formats, from plain text files (e.g. historical time series) to structured XML-based (e.g. KML for geographical information), binary (e.g. climate data) and graph-type (e.g. RDF for Linked Open Data) options. The volume and variety of EBD pose non-trivial challenges for data providers in terms of storage and transfer6. Data storages are gradually moving from traditionally highly structured SQL-based systems to less structured and more flexible NoSQL solutions.
The perception of data as static information is also changing in favour of live streams, coming from sensors as well as internet-enabled objects and online social networks. Twitter feeds, for instance, are currently mined to identify the extent of natural disasters7 and characterize earthquakes8. Sensors and network connections stream raw data, which need to be analysed before storage and dissemination. But the velocity at which we can analyse data streams is often a major bottleneck. To make the most out of the booming this fast growing mountain of data, we’ll therefore need faster and more efficient tools.
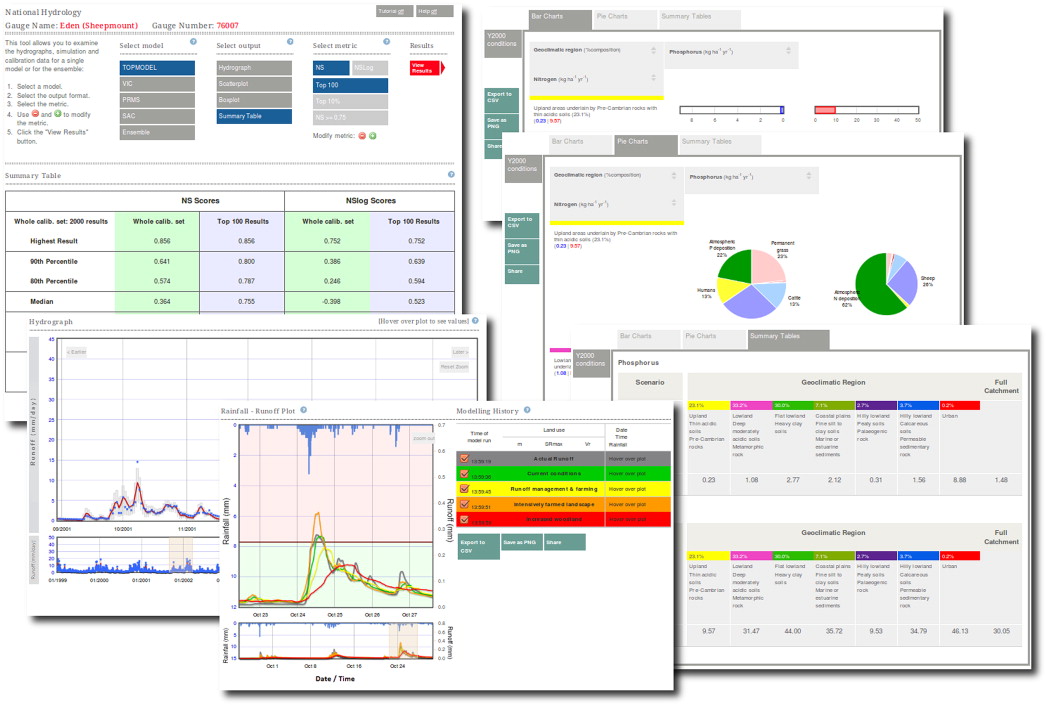
Web based hydrological processing and visualization prototypes as explored by the UK NERC funded EVO pilot project
In computer science, new methods such as Information Retrieval, Machine Learning and Artificial Intelligence are emerging to automate data analysis and extraction of trends and patterns from raw data. Additional advantages can be also achieved by migrating processing tools from desktop software to web services and by making use of cloud infrastructures for distributed processing. Moving towards web-based technologies has the advantage that it makes analyses easier to share and to reproduce. But it also requires standardised methods to access data and models and make them interoperable. A good example of an initiative enabling this is the Open Geospatial Consortium (OGC)9, which sets interface standards for geospatial information and contents. Thanks to such efforts, the scientific community can build upon over 30 standards to handle and transfer data and metadata and deploy mapping and processing services. Some of these standards have been adopted by many data providers and are already extensively used in scientific applications, such as Environmental Virtual Observatories (EVOs — see figure above). The term EVO was coined by the eponymous UK NERC pilot programme to harness big data and cloud computing for environmental science10.
EVOs can be seen as shared, cross-domain research environments to build data analysis workflows incorporating data and modelling tools. A web-based, distributed platform allows for supporting a wide range of users including not only modellers and practitioners, but also decision and policy makers and potentially the general public. From a governmental perspective, opening these tools to non-experts can be considered a strategic move, as it empowers the public to understand more about the environmental issues and participate more actively to the decision making process.
As tools for communicating science, EVOs make extensive use of infographics. For example, maps and plots are made interactive to provide user-driven data content. The aim is to enrich the learning experience and engage expert and non-expert users with intuitive access to, and insightful analysis of, data and model results.
In summary, the future of environmental science is paved with important technical challenges related to the growth of environmental Big Data, from more efficient data storage, streaming and analysis to more intuitive and interactive communication tools. First steps towards the successful integration of open data-model-visualisation tools have been achieved in VO-type applications.
A more comprehensive overview of the potential of web-based technologies for environmental analysis can be found in our recent review paper11.
References
1. SINTEF, 2015. “Big Data, for better or worse: 90% of world’s data generated over last two years.” ScienceDaily. www.sciencedaily.com/releases/2013/05/130522085217.htm
2. CSC, 2015. “Big Data Universe Beginning to Explode.” http://www.csc.com/insights/flxwd/78931-big_data_universe_beginning_to_explode
3. Kogan, F., Powell, A., Fedorov, O., 2010. Use of Satellite and In-Situ Data to Improve Sustainability. Springer, http://www.springer.com/gb/book/9789048196173
4. Tsou, M., Guo, L., Stow, D., 2003. Web-based Remote Sensing Applications and Java Tools for Environmental Monitoring. Online Journal of Space Communication 3., http://spacejournal.ohio.edu/issue3/abst_tsou.html
5. Buytaert, W., Baez, S., Bustamante, M., Dewulf, A., 2012. Web-based environmental simulation: bridging the gap between scientific modeling and decision-making. Environmental science & technology 46 (4), 1971–6. http://dx.doi.org/10.1021/es2031278
6. IBM, 2015. “The Four V’s of Big Data”. http://www.ibmbigdatahub.com/infographic/four-vs-big-data.
7. Yasin R., 2015, “Project mines tweets, satellite and drone imagery for disaster response“. GNC. http://gcn.com/articles/2014/05/02/carbon-scanner.aspx
8. Earle P., Guy M., Smoczyk G., Horvath S., Turner J., Bausch D., “Feasibility of Twitter Based Earthquake Characterization From Analysis of 32 Million Tweets: There’s Got to be a Pony in Here Somewhere!” AGU Fall Meeting 2014, San Francisco, USA.
9. OGC, 2015. http://www.opengeospatial.org/
10. NERC, 2015, http://www.nerc.ac.uk/research/funded/programmes/virtualobservatory/
11. Vitolo, C., Elkhatib, Y., Reusser. D., Macleod C.J.A., Buytaert, W., 2015. Web Technologies for Environmental Big Data. Environmental Modelling & Software 63, 185–198. http://dx.doi.org/10.1016/j.envsoft.2014.10.007
[/read]
0 comments