A timeline of developments at SMHI’s hydrological forecasting and warning service
Contributed by Göran Lindström (SMHI) and Henrik Spångmyr (SMHI, Midvatten AB), members of the SMHI Guest Columnist Team
The Swedish Meteorological and Hydrological Institute (SMHI) has a long tradition in developing customized products and services, as well as 24/7 production of forecasts with early warnings. In this blog, we summarize the development over time of SMHI’s hydrological forecasting and warning service.
The first hydrological forecasts at SMHI date back all the way to 1913. Statistical methods for converting winter precipitation into forecasts of spring flow volumes and lake water levels were used until the 1980s, whilst computerized forecasts have been made for about 40 years. This summary focuses on the computerized era starting in the 1970s. Important steps that have led to the present situation are summarized in Fig. 1 and described in more detail below.

Fig 1. A 50-year overview of the development of hydrological forecasts and warnings at SMHI.
1970s
The HBV model has had a major role in hydrology at SMHI since it was developed in the 1970s. One of the applications that SMHI had in mind when starting the development was actually calculations in basins without measurements, what we today call PUB (Predictions in Ungauged Basins). The first HBV version was ready in 1972, but the model in its commonly known form was presented in 1976. The model came in handy already the following spring when the melting of large snow amounts caused floods in parts of southern Sweden, particularly in Bergslagen. The hydropower industry quickly became interested in HBV as a tool for predicting the inflow to hydropower reservoirs; about half of the electricity production in Sweden comes from hydropower. The first models were written in ALGOL-Genius but later rewritten into FORTRAN.
1980s
The early HBV models were run on mainframe computers, both Sperry-UNIVAC and later VAX/VMS. In the 1980s the IBM compatible PCs became available. The HBV model was ported to PC in a DOS version. The code was completely re-written, this time in BASIC. This version was called HBVTL, to indicate that it now contained both shorter time steps than 1 day and lake routing. Each forecast basin was stored on a separate diskette. The main application was long range forecasting of spring flood inflow to hydropower dams. Hydrological design floods for dams were already in focus and new guidelines were being developed.
The break of the Noppikoski dam, in River Oreälven in September 1985, further underlined the importance of dam safety analyses and of hydrological forecasts and warnings. Although there were HBV models available for many basins in Sweden, these were not run daily in an operational mode.
A research version of HBV, called PULSE, was developed for water quality applications; mainly acidification studies. Prediction in ungauged basins was an important task. Different methods to measure snow conditions were tested, with the aim of updating the snow pack in the HBV model. Tests included, for instance, satellite images, snow measurements by airborne gamma radiation and by georadar. For hydrological warnings a synoptic water balance map was developed, which was basically a simplified HBV model for each synoptic weather station in Sweden. Water balance components, such as snow, soil moisture and runoff generation, were computed for the five days preceding the current day. The results were presented daily on a map, in order to provide an overview of the current hydrological situation in the whole country. Forecasts were not yet included.
1990s
A new HBV version for Windows was developed, called IHMS (Integrated Hydrological Modelling System). The new model was written in FORTRAN77 and included the HBV-96 model version, with automatic calibration and automatic updating among other things. A 4×4 km gridded precipitation and temperature data set, named PTHBV, was developed based on optimal interpolation. Most of Sweden was now covered by HBV models developed for various purposes, but still mostly for forecasting snow melt inflow to hydropower reservoirs.
A set of about 60 well calibrated basins, called indicator basins, with real-time data transfer were set-up to provide an overview of the hydrological situation. Hypro, a tool for presentation and visualization of forecasts was developed. The spring flood in 1995 caused high flows in many of the unregulated rivers, from Värmland in the south all the way to the northernmost parts of the country. The synoptic water balance map was enhanced into a full HBV model for each synoptic weather station. Forecasts were now introduced. Daily hydrological forecasts were then available, for points in the whole country. The parameters in the model represented small, lake-free basins with a quick response. The water balance map therefore often gave the first indications of high flow situations. An HBV model version in very high spatial resolution for all of southern Sweden was developed for modelling of nutrients.
2000s
The year 2000 is the year with both the highest recorded precipitation and runoff in Sweden. Summer rains filled up many regulated rivers, and later in the year, autumn rains over lake systems with low outflow capacities led to a flood situation that lasted for several months. To cope with future situations of this type, a special flood organization was introduced at SMHI. This means that hydrologists from other departments can be called into service during such events. A group of about 10 hydrologists take turns as forecasters on duty, for one week at a time. A tool, called Aegir, was developed for automatic production of daily hydrological forecasts, with different model versions and weather forecasts. Hypro was developed into Web-Hypro, a web-based interface that was used by the SMHI, hydropower companies and others.
A new national version of the HBV model was set-up and regionally calibrated. The new model, called HBV-SV, consisted of 1001 sub-basins. Ensemble weather forecasts, EPS, from ECMWF were used as the basis for daily streamflow probability forecasts, and these were made available to the public on the internet. Autoregressive error prediction was introduced with regular evaluations showing that this significantly improved the short-term forecasts. The development of a new hydrological model, HYPE (Hydrological Predictions for the Environment) was started, mainly with emphasis on water quality applications.
The present
A HYPE model for all of Sweden, named S-HYPE, was set-up in high spatial resolution (about 37000 sub-basins). The high resolution provided additional value since the whole country was now covered by a rather well-calibrated hydrological model in high detail.
Web-Hypro had become technologically outdated and a new visualization tool, HYFO, was developed. HYFO presents results from both the HBV and S-HYPE models. Aeigr is still the operational heart of the production chain, and delivers observations and results from both deterministic and ensemble forecasts. Both updated and non-updated model results are presented in HYFO, so that errors due to for instance ice jams do not distort all forecasts.
Warnings are issued depending on the expected return period (2.5-10 years, 10-50 and > 50 years). It was a technological challenge to handle the high spatial resolution in S-HYPE, but HYFO has now been in use for about two years. The water balance map is no longer used, but the local runoff in S-HYPE reacts quickly and gives improved capabilities to capture flash-flood like situations. The local runoff is delayed through the network of rivers and lakes, which means that the hydrological situation may be quite different within a region (see Fig. 2), with receding flows in lake-free parts at the same time as the discharge increases in systems with a high lake percentage.
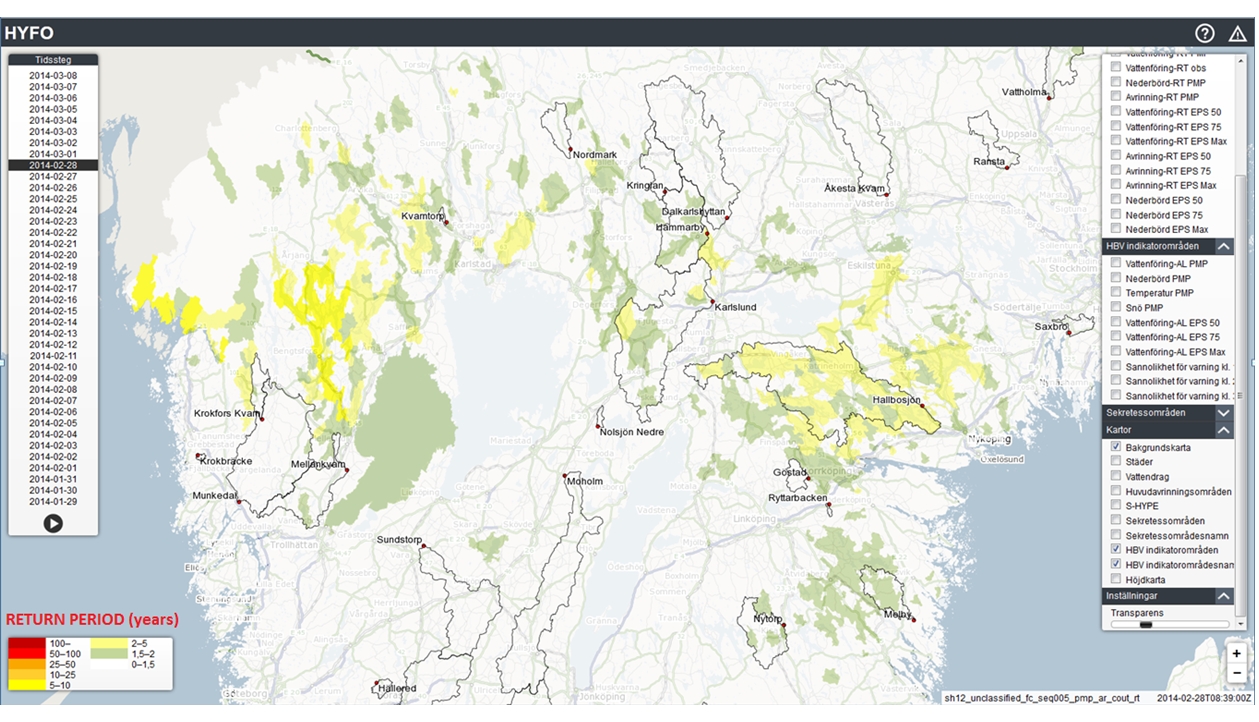
Fig 2. An example from HYFO showing the hydrological situation on 28 February 2014, in high spatial resolution from S-HYPE. Black lines show the water divides and corresponding discharge stations for the indicator basins.
The vast amount of hydrological information that is now available provides improved possibilities for local predictions, but also new challenges. It is more difficult to issue general warnings for a region. The way in which warnings are communicated to users is a question that is likely to receive more attention in the coming years.
Models results have been of good quality for very long (Fig. 3). The number of modelled basins and the amount of disseminated information is what has increased the most, mainly thanks to the technological advances in this period. Hydrological process descriptions and model performance have also improved.
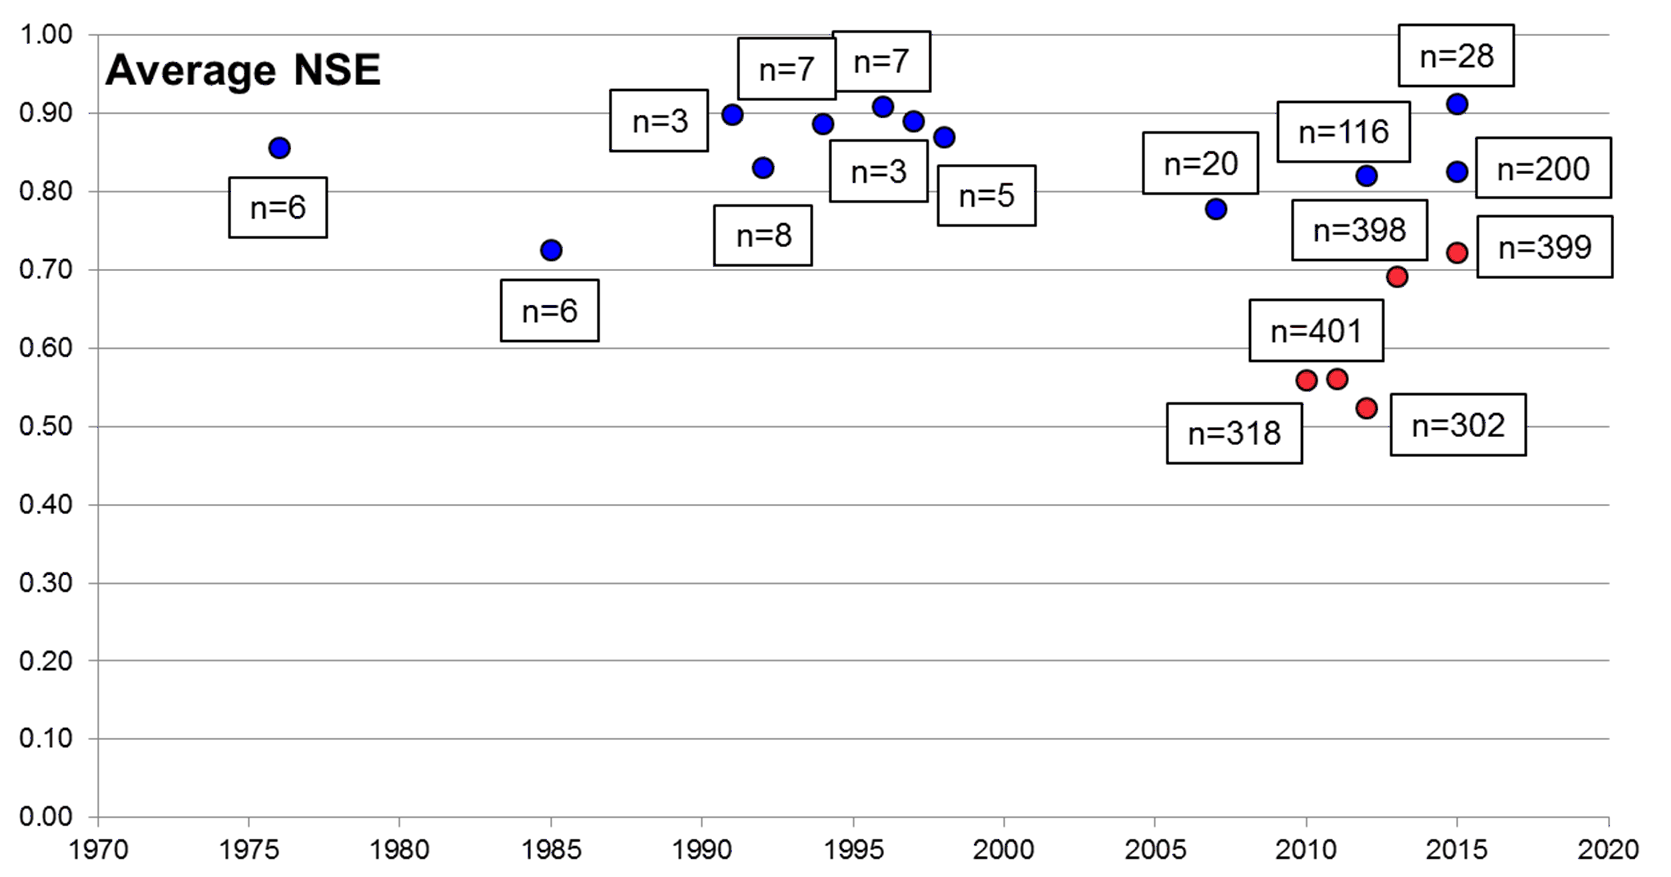
Fig 3. Average Nash-Sutcliffe Efficiency (NSE) from selected multi-basin applications, blue = only unregulated flow, red = including regulated flow. n = number of stations.
In addition to calculating river discharge, more variables are nowadays included, e.g. snow depths, lake levels etc., while information is disseminated in both deterministic and probabilistic manner. The present state of the hydrological and warning service at SMHI is thanks to the many steps that have been taken over time.
March 17, 2016 at 19:53
Thanks for http://riverinfo.eu/ too 🙂