How can the Brier score know my inner thoughts???
Contributed by Anders Persson, a HEPEX guest columnist for 2014
Inspired by Tom Pagano’s interview with Beth Ebert on verification 22 August, I would support Beth’s enthusiasm by pointing out some more exciting features in the verification statistics:
1. The problem to interpret the statistics: what “looks good” might be bad, what “looks bad” might be good”. One morning in 1995, the ECMWF Director pressed the alarm bell. The most recent verified five-day forecast scored minus 20% in the anomaly correlation against normally around plus 70%. The other models were worse than normal, but not below 30%. But there was no major problem, just a matter of “double penalty”. The ECMWF forecast was penalised for having a storm, east of Scotland, where there was none and then penalised for not having one, west of Scotland, where there was one. The other models were punished only once – for not having the storm at all.
2. The problem with the verifying observations – it is not always obvious what is the “truth”. At SMHI, verification of the gale warnings started in the 1920’s. They showed a steady improvement until late 1950’s, when the scores dropped. It was because off-shore lighthouses along some coastal stretches had been closed. The remaining in-shore ones were slow to respond to off-shore gale force winds. We, forecasters, were thoroughly educated in semantics, how to formulate the shipping forecast, so, on one hand, the sailors were warned, and, on the other hand, we didn’t have to issue a formal warning in cases of off-shore gales – and thus worsen the statistics.
3. The challenge with probability forecasting. The non-intuitive, and therefore fascinating, nature of probabilities, also applies to their verification. As an example, let me introduce perhaps the most common probability verification score, the Brier score (BS), after its inventor Glenn W. Brier (1913-1998).
Mathematically, the BS is quite simple. It is the average of the sum of the squared difference between probability and event counted as 1 or 0, if it occurred or not. The lower the BS, the better.
If the forecast probability is P and the verifying observation is O, then, for a single forecast, the contribution to the Brier Score verification is BS1 = (P-O)2. If the event occurs O=1, if the event does not O=0, (figure 1).

Figure 1: The possible contribution BS1 = (P-O)2 from one probability forecast to the Brier Score for the full range of probabilities (0% to 100%) in case of rain (green line) and no rain (amber line). If, for example, a 70 % forecast is issued, then the contribution is BS1=0.09 if rain follows, and BS1=0.49 if it stays dry.
The total BS is an integrated or averaged sum of all BS1 contributions over a longer period. Its value depends on the climate of the region, i.e., on how often the forecasters have reasons to issue different probabilities.
However, the Brier Score is a so called “proper score”, which means that it will punish you if you make a forecast that you do not quite believe in. Strange, how can the lifeless simple mathematics know about my inner thoughts? Is it some “Big Brother” I have not been aware of?
Hedging the bets
Assume you are issuing a probability forecast for storms in the mountains, flooding on the plains or cold outbreaks. You are an experienced forecaster with reliable probability forecasts, i.e., when you, on 10 occasions, have said “the probability is 20%” the event will, on average, occur twice; when you have said 80%, it will on average occur eight times.
One day you estimate the probability to 50%. With a 50% forecast (P=0.5) the BS1 will score 0.25 irrespective if the event occurs or not since BS1=(1-0.5)2 = (0-0.5)2=0.25.
But for different reasons, you are not happy to issue that 50% value. You might for example suspect that 50%, or 50-50, might be interpreted as “we do not know”. So you issue a 40% probability forecast instead.
BS1 will take two different values depending on if it rains or not. The most likely value is a weighting together of the two. Here comes the crucial point: If you use the weights 0.4 and 0.6, which would be logical since you issued a 40% forecast, the likely BS1-value will be slightly worse than if you use the weights 0.5 and 0.5 on the BS1-values of true 50% opinion (figure 2).

Figure 2: If, for misguided reasons, the forecasters issue a “dishonest” 40% probability forecast, the BS1 will score +0.11 more (to BS1=0.36) if it rains, and -0.09 less (to BS1=0.16) if it stays dray. If it had been an “honest” 40% forecast the latter case (no rain) would have been more probable than the former (rain) and this would have yielded an expected BS1=0.24. However, since the true probability is 50%, both outcomes are equally likely and the expected BS1=0.26, which is slightly worse.
You can apply the same reasoning to a case when you would like to “sex up” your 50% forecast to a 70% probability (figure 3).
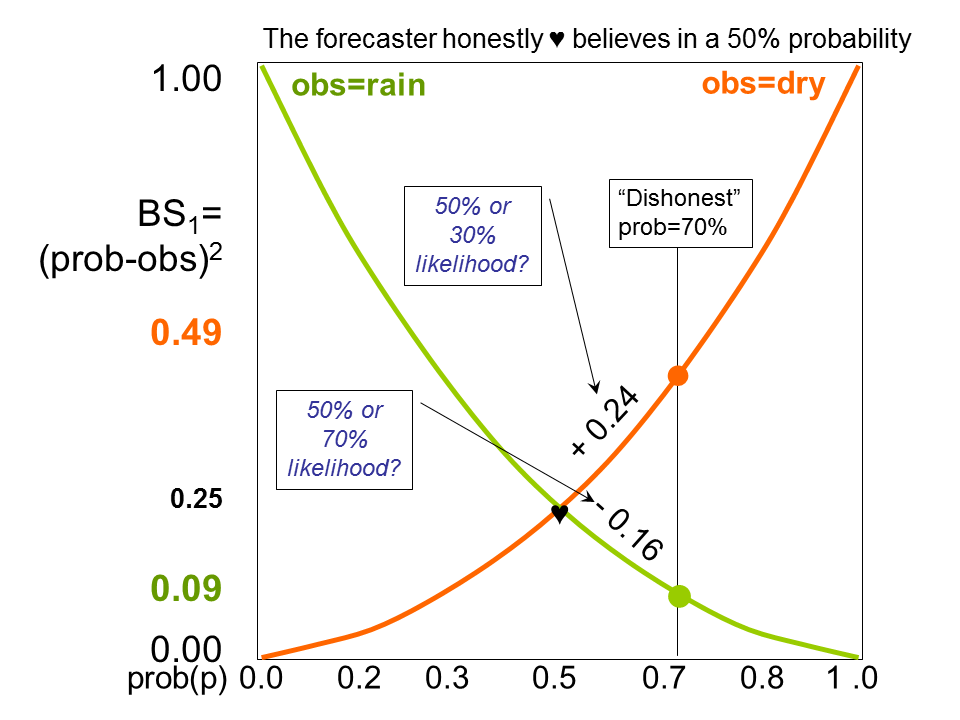
Figure 3: The same as in figure 2, but now the “dishonest” probability forecast is p=70%. If it doesn’t rain, the BS1 will worsen by +0.24 (to BS1=0.49), if it rains, it will improve by -0.16 (to BS1=0.09). If 70% really had been the “honest” probability, the latter (rain) would be more likely than the former (no rain), and the expected BS1=0.21. But since the “honest” probability is 50%, both outcomes are equally likely and the average score will yield an expected BS1=0.29, and thus worsen your performance by +0.08.
Again, depending on if it will rain or not you will get two BS1-values. If you weight them together with 0.3 and 0.7, which would be logical from your 70% forecast, you will do worse on average than weighting the BS1-values of the true 50% opinion, with 0.5 and 0.5, the weights you have reasons to trust more.
Do I dare to change an automatic probability forecast?
Being an experienced forecaster with a record of reliable probability forecasts, there is nothing to fear. You should not hesitate to modify a probability forecast provided by a reliable probabilistic system, such as the ECMWF ensemble system if you have good reasons.
If the ensemble suggests a probability of 30% you can very well increase the probability to 50% or even 70% (or decrease to 30% or 10%) if you have additional information (for example, from newly arrived observations and/or deterministic forecasts).
It is only when you, for political or psychological reasons, want to change the forecast against your “better judgement” that the “proper” Brier Score will punish you. More mathematical arguments for this “moral” attitude are found in figure 4.
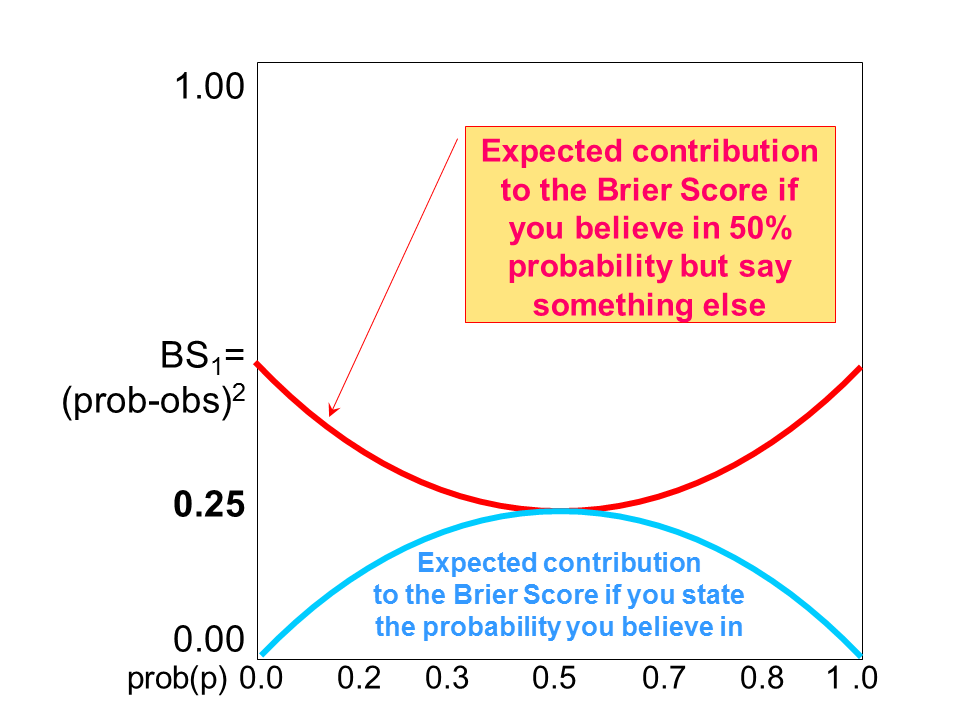
Figure 4: The lower, light blue curve, shows the expected BS1 in case of “honest” probability forecasting. The amber curve shows the BS1 in case the “honest” forecast would be 50%, but the forecasters for different reasons say something else between 0% and 100%.
The peril of relying on deterministic numerical output.
The final figure 5 illustrates a location with 50% climatological probability of rain (182-183 days/year). The well tuned state-of-the art deterministic NWP model predicts rain and no rain equally often, but, of course, not perfectly. If the forecasters blindly follow this model and issue categorical “rain” or “no rain” forecasts, they will score badly. The same will happen if they make categorical interpretations of probability information.
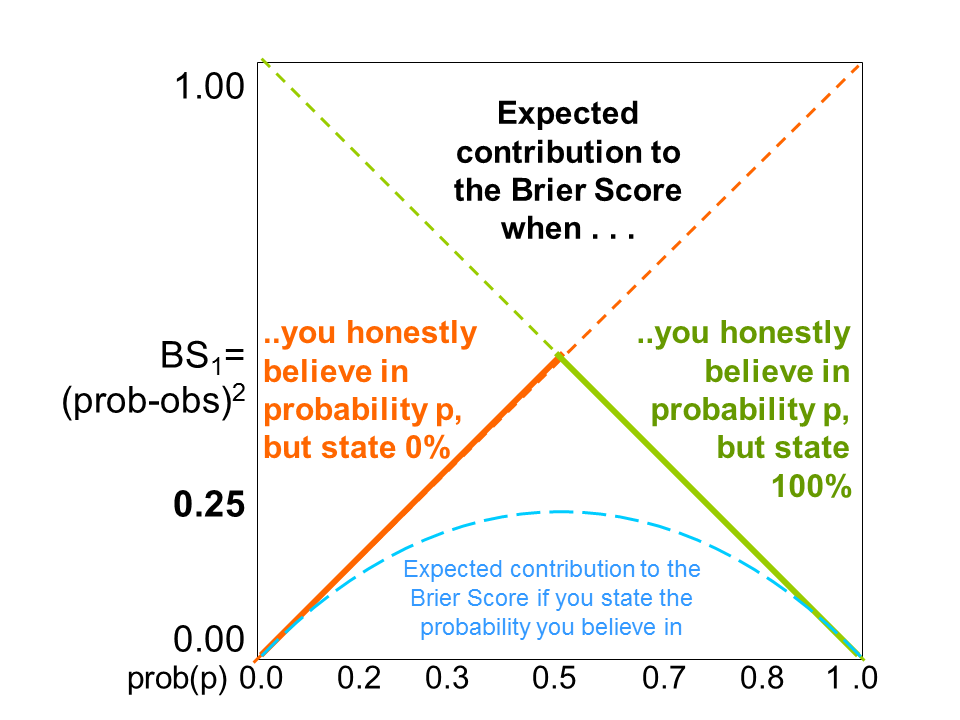
Figure 5: If the forecasters blindly follow a deterministic model and issue categorical “rain” or “no rain” forecasts (0% or 100% probabilities) unaware of or ignoring any probability information from a probabilistic forecast system, e.g. an ensemble system, they will score according to the dashed-full lines. If, however, they have access to such a system but chose to interpret the probabilistic information deterministically, i.e.issue “rain” (100%) forecasts when the probability is >50% and “no rain” (0%) forecasts when the probability < 50%, they will score badly, more precisely along the full lines, with a peak of BS=0.5 for 50%.
December 19, 2014 at 14:40
Fully agree with what you say here, Anders. I believe the paradox would be taken away, however, if we wouldn’t use the phrase “honest belief” and instead replace it with “true probability”. Yes, the Brier Score will be worse if you move away from issuing the “true probability” – that’s a lot easier to grasp than “moving away from your inner thoughts”. (The problem that arises, however, is that you’ll need a forecaster who’s able to know the “true probabilities” – what’s the magic formula for that?)
January 14, 2015 at 16:04
Jan: As far as I understand there not such as thing as a “true probability”. In a given situation you would say 30% and I would say 70%. None of us will be “right” or “wrong” of course, but neither can anybody have opinions about our forecasts.
The only thing that could be used to determine who is “best” (if this is important) is an evaluation of our forecasts over a longer time period. If things happen 8-10 times after thirty of your “30% forecasts” you are generally a reliable forecaster, whereas I, who find that after my thirty “70% forecasts”, things occur 14-16 times can be blamed for being a rather unreliable one, systematically over-forecasting the higher probabilities.