How to bring out the “intuitive statistician” in every forecaster
by Anders Persson
It is all Erik Andersson’s fault. In autumn 2010, he recruited me to update the “ECMWF User Guide”, a task that was completed the following May. I had booked a flight back home and was looking forward to indulge myself in my then favourite hobby, 19th century Finnish war poetry, when Erik wanted me to stay for another half year. He was not quite happy with the “Guide”. Instead of 2/3 of the contents presenting the ECMWF forecast system and 1/3 how to make best use of the products, he wanted the reverse.
[read more=”Read more” less=”Read less”]
During the 25 years of existence of the Guide, which was regularly updated, nobody had suggested that the proportions should be reversed. But Erik thought so because he had once, before coming to ECMWF, been involved in practical weather forecasting (Figure 1).
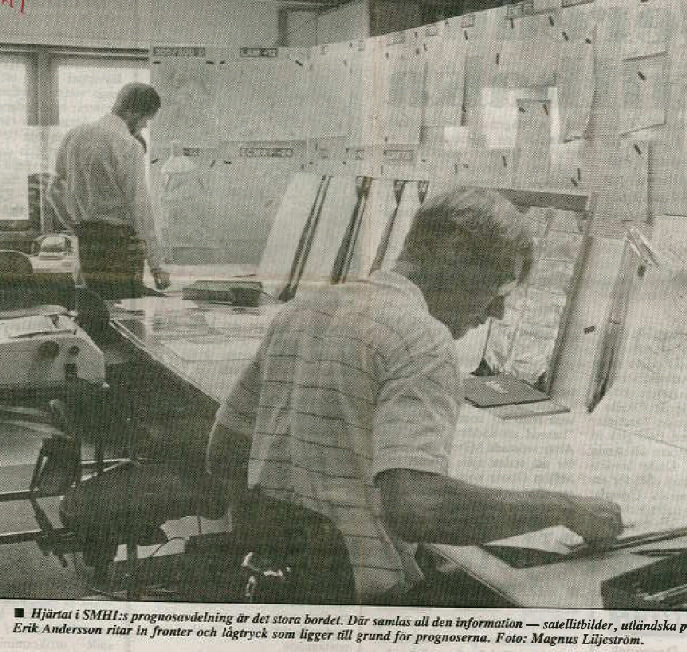
Figure 1. From the Swedish daily “Länstidningen i Södertälje” 27 July 1985. “The heart of the forecast office at SMHI is the large table. It is where all the information is gathered – satellite images, foreign forecast maps etc. Erik Andersson draws fronts and low pressure systems which make the basis for the forecasts”.
My final half year at ECMWF reworking the User Guide turned out to be very stimulating. Erik’s request forced me to really find out what weather forecasting is about. I came to realize that to be a skilful forecaster was not only about having a good grasp of meteorology, or even of numerical weather prediction (NWP), but something we call “experience”. But what is “experience”?
The forecaster as an “intuitive statistician”
“Experience” is not only about remembering a lot of past events, it is about systematising these events into handy “thumb rules” that can easily be used in the heat of operational activity. The crucial point was how this “systematisation” was made. From my own and others’ experiences, I knew that there is always a risk of drawing the wrong conclusions, in particular if too few cases are considered.
Making inference from too few observations is also a common problem in statistics. So, during summer and autumn 2011, I gradually became aware that forecasters systematizing their experiences have to act like some sort of “intuitive statisticians”. These insights were partly reflected in the 2011 edition of the User Guide (in particular Appendices A and B) and in the interview Bob Riddaway conducted with me (pages 8-12).
Back to Scandinavia in winter 2011-12, there was no time for Finnish war poetry: Andrea Piazza and his team at the Civil Protection in Trento had found my ideas interesting and invited me as a lecturer to their annual course for Italian forecasters. Then came an invitation to a Nordic meeting in Copenhagen and then from Bologna…
A week’s course on probabilities?
Gradually an idea developed about a week’s course in elementary statistics, in particular probability theory: Monday could be devoted to classical probabilities (tossing coins etc), Tuesday on frequentist probabilities (e.g. climatological probabilities), Wednesday on subjective probabilities, Thursday on decision making from probabilities and Friday, last but not least, on the psychology of probabilities.
A chance to realize the idea came in February this year when the meteorological service in Bologna organized a week long course “Probability and uncertainty: two concepts to be expanded in meteorology”
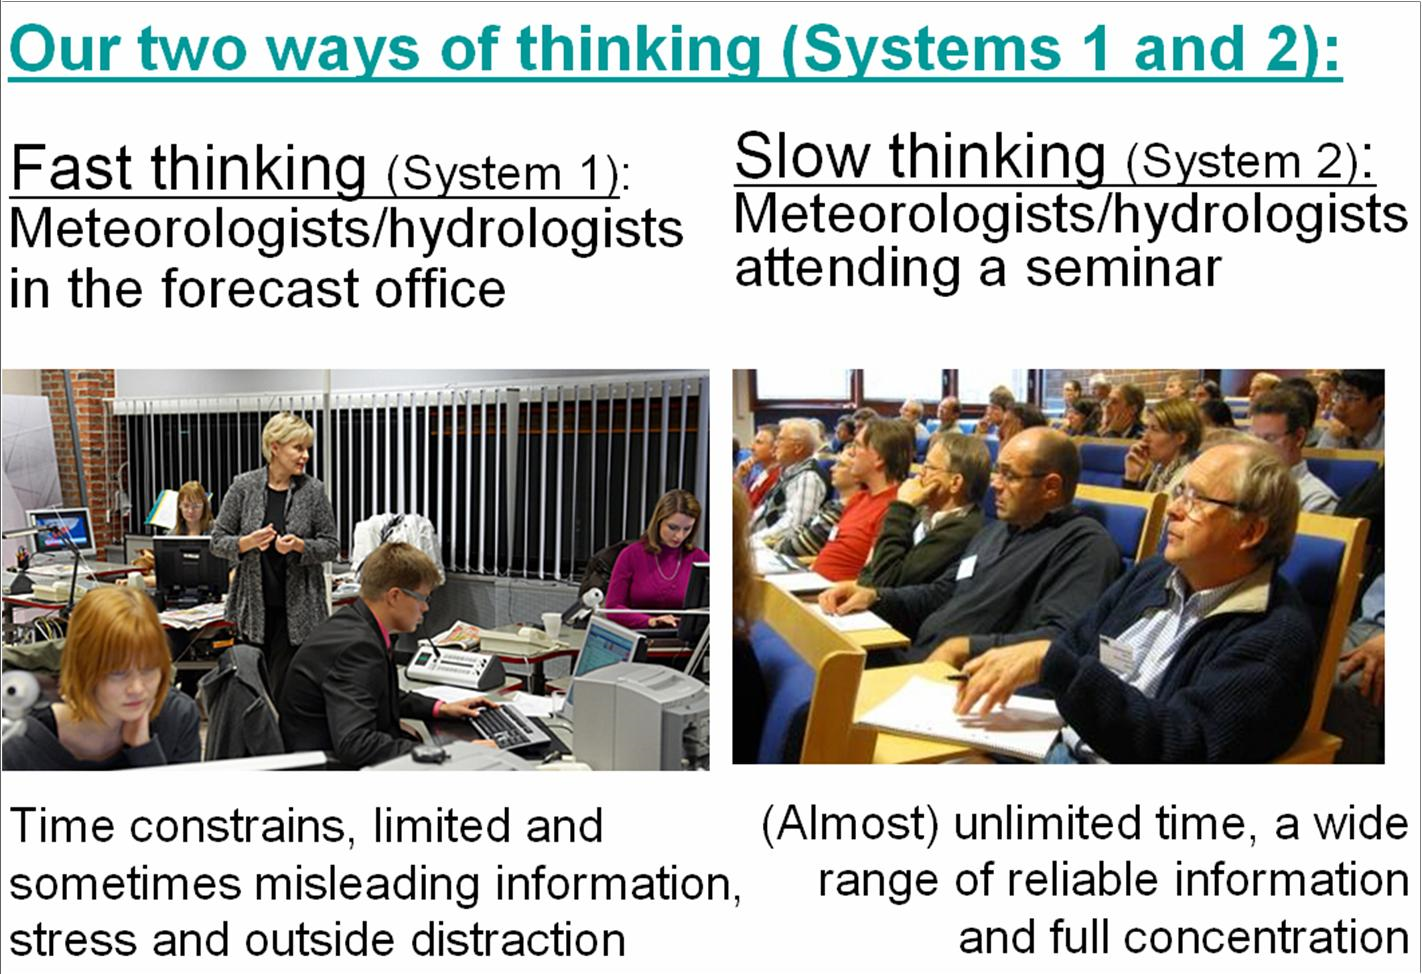
Figure 2: The fast and slow thinking in our sciences. The challenge is to find way to make the wisdom on the right hand side transpire into the left hand side, to make scientific knowledge survive in the chaotic operational environment and benefit the performance.
The course should not be about statistics and probabilities in general; it had to be tailor-suited for forecasters. An eye opener had been Daniel Kahneman’s “Thinking fast and slow”, where he pointed out that what we learn on courses, seminars, etc. stay in the slow thinking part of our brains, what he called “System 2”, but had to be converted or translated to fit into the fast thinking, “System 1”.
A well attended course
The course attracted a great interest among Italian meteorologists with 40-50 participants. There were also some participants from Switzerland, France and Spain. The full course schedule can be seen here.
I am not sure all of my lectures were 100% tailor-made to the forecasters need. But nobody complained and I felt a good response from the audience. Thanks to the questions and discussions during and after the lectures, I also learned a lot myself!
When it threatened to become too boring, we played with the “Trento dice set” (Figure 3), which Andrea Piazza had brought with him. For more more details on the use of the dice and downloadable pdfs of the Bologna lectures see here.
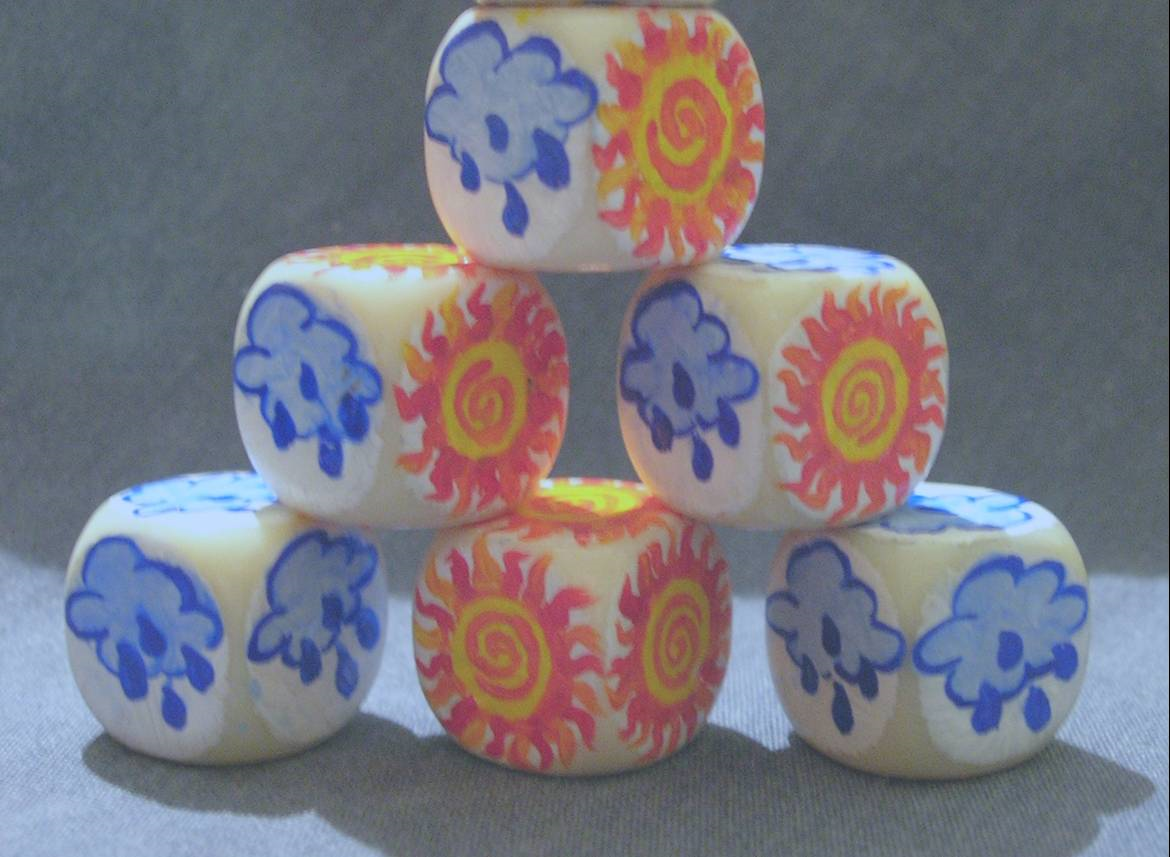
Figure 3. The six dice constructed for the Trento meteorological winter course in 2005. Each dice has 1, 2, 3, 4, 5 or 6 rain clouds (alternative blazing sun shine). A copy was later made using Finnish wood and decorated by an English artist in Norrköping, Sweden. The set was lent to the WMO and ECMWF training courses where it has been used with great success thereafter.
There is still much room for improvements and new ideas, if a similar course will be repeated. Personally, I believe that a stronger emphasis on the Bayesian statistical philosophy would be fruitful, very much since the manual forecast process itself is very “Bayesian”. I also feel that future courses should cover more the interpretation of verification statistics, not just their mathematics: “Have we succeeded? What shall we do?” As Tim Palmer once said: – What looks good might be bad and what looks bad might be good.
[/read]
April 5, 2015 at 23:02
Anders, you lucky thing: must be great to be able to spend a full week on this. Does your Friday lecture include prospect theory, probability interpretation, etc? If not, I can show you some of the topics we’re covering in similar courses (one day only 🙁 ) for hydrologists. And yes, interpretation of verification results is important – at the end of the day, one will have to make a decision based on the metrics – but this is often overlooked. And yes, Kahneman’s fabulous book applies – although I’m not sure if the left picture above is indeed the ‘fast’ system he talks about.
April 9, 2015 at 16:31
Jan and others,
All the lectures are downloaded as pdf:s at a special HEPEX site
https://hepex.inrae.fr/resources/a-course-on-probability/
Anders