Operational Forecasting of Severe Flooding Events in Rio de Janeiro
Contributed by Lloyd A Treinish
Deep Thunder – In 1996, IBM began exploring the “business of weather,” hyper-local, short-term forecasting and customized weather modeling for clients. Now new analytics software, and the need for organizations from cities to energy utilities to operate smarter, are changing the market climate for these services.
The safe operation of many cities is dependent upon weather conditions, especially with regard to relative extremes in wind, precipitation or temperature.
Together with precipitation events, local topography, surface characteristics and weather conditions influence water runoff and infiltration, which directly affect flooding.
The impact of such events creates issues of public safety for both citizens and first responders. Therefore, the availability of highly localized weather predictions focused on municipal operations has the potential to mitigate the impact of severe weather on citizens and local infrastructure.
To understand the business implications of these ideas, IBM Research has an on-going project, dubbed “Deep Thunder”.
In particular, the ability to predict specific events, with sufficient spatial and temporal precision and lead time, coupled to their operational impacts is being addressed to enable proactive allocation and deployment of resources to mitigate the effects of severe weather and increase time for planning.

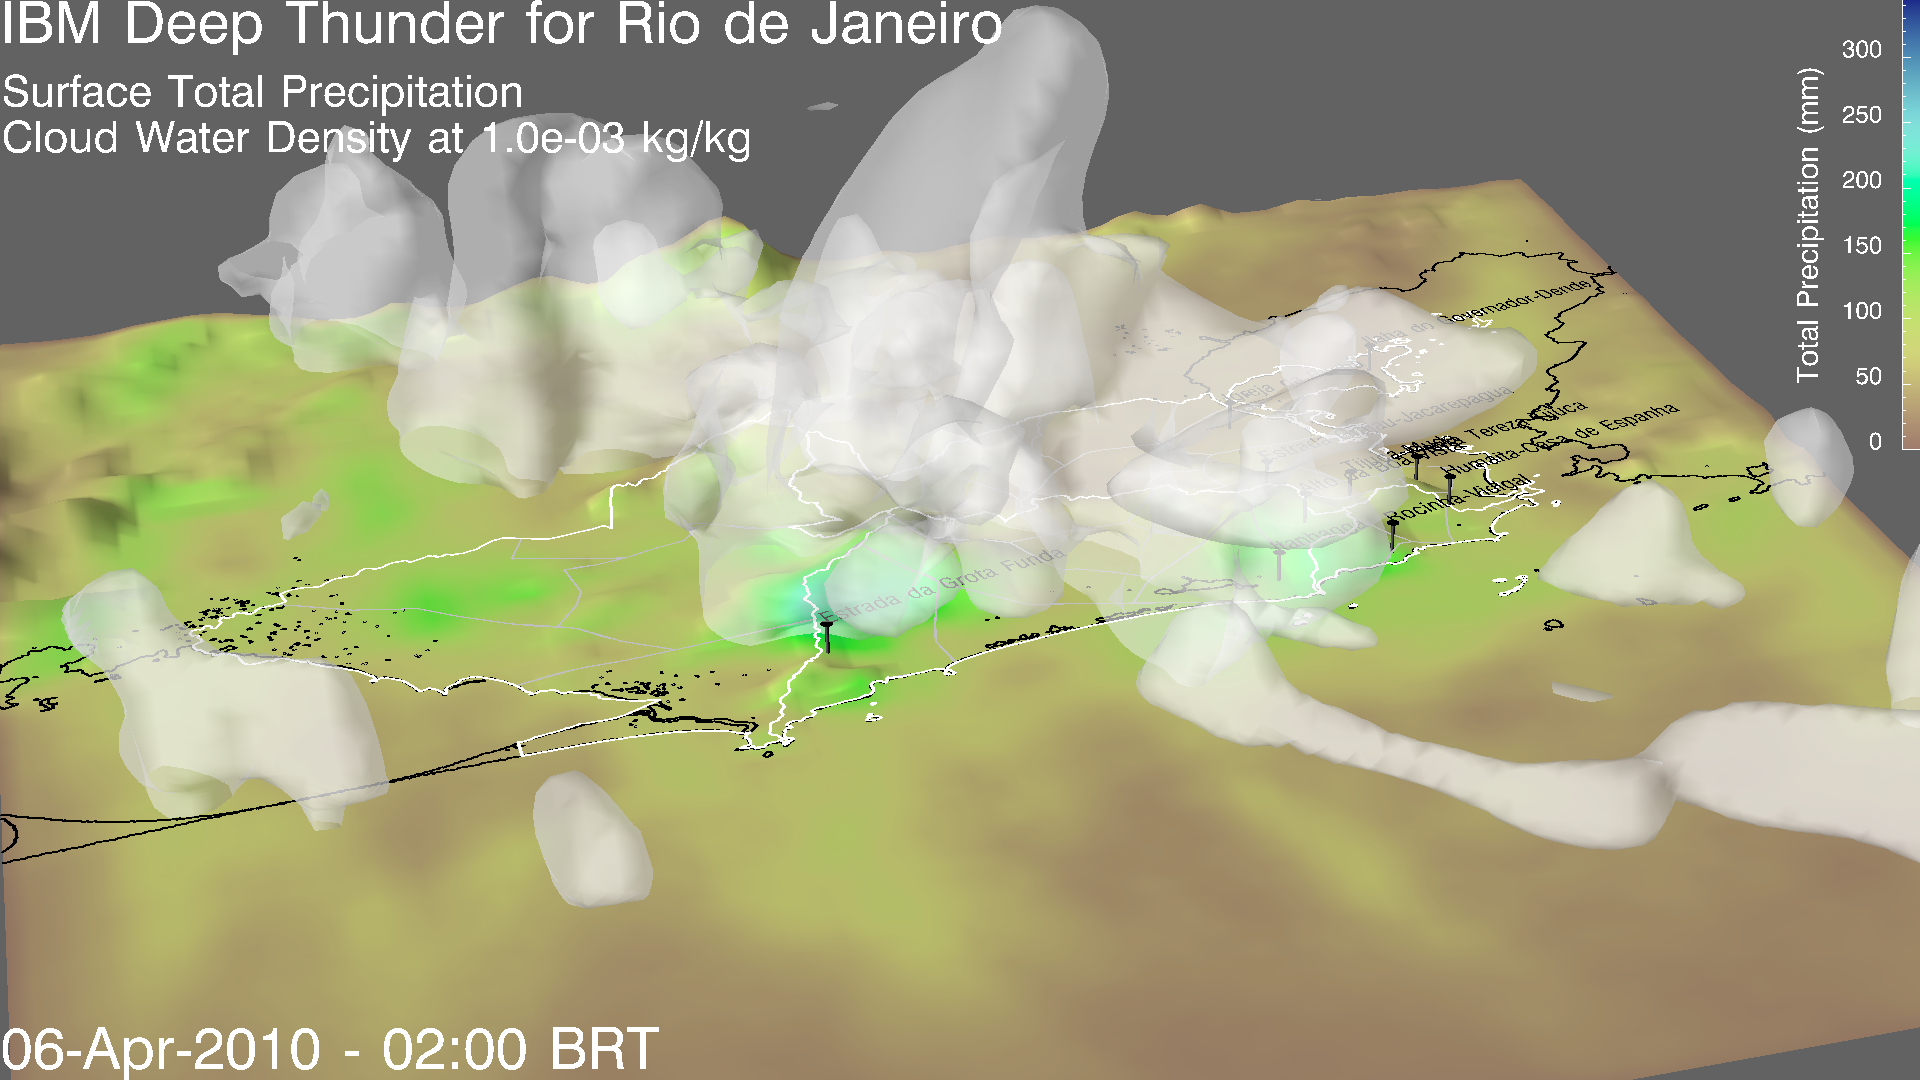
The storm and mudslides in Rio de Janeiro on April 6, 2010 left over 200 dead and thousands homeless. The event prompted the city to start planning the development of central emergency operations center to include Deep Thunder forecasting and other capabilities. (source: http://www-03.ibm.com/ibm/history/ibm100/us/en/icons/deepthunder/)
The city of Rio de Janeiro often faces the consequences of intense rainfall, which include landslides and flooding.
In early April 2010, the city endured one of the worst storms in decades with over 300mm of rain recorded in less than one day in several areas. There was significant loss of life and tens of thousands lost their homes.
To assist in planning for such events in the future, the city’s leaders have enabled sophisticated capabilities for the coordinated management of emergencies. As part of that effort, the integration of advances in hydro-meteorological research is required. Given the geography of the city, such capabilities have significant challenges.
In addition to its near-tropical setting along the coast of the Atlantic Ocean (the western portion of Guanabara Bay and the eastern portion of Sepetiba Bay), there are regions where the terrain has a high aspect ratio, related to the Serra do Mar mountains. Although sea breezes moderate the temperatures along the coast, especially during the summer, cold fronts from the Antarctic can lead to rapid changes in local weather. Of particular concern is the rainy, summer season from December to March, during which precipitation events occur and significant flooding becomes likely.
State-of-the-art numerical weather prediction models operating at the meso-gamma scale have been shown to have potential in predicting weather conditions at the scale that a city like Rio de Janeiro requires. Therefore, the WRF-ARW community model was adapted for use in this area, beginning in early 2011.
An operational configuration was developed by retrospective analysis of significant precipitation events and compared against data from a network of 32 rain gauges operated by the City Government. Those results coupled with throughput and computational considerations led to a configuration of four two-way nests focused on the Rio de Janeiro metropolitan area at one km horizontal resolution.
To address the orographic influence of the complex terrain, 65 vertical levels were established with typically the lowest 15 being within the boundary layer. The configuration has parameterization and a selection of physics options appropriate for the range of geography in the region and the weather conditions of concern.
This configuration was placed into operation in May 2011, producing 48-hour forecasts every 12 hours.
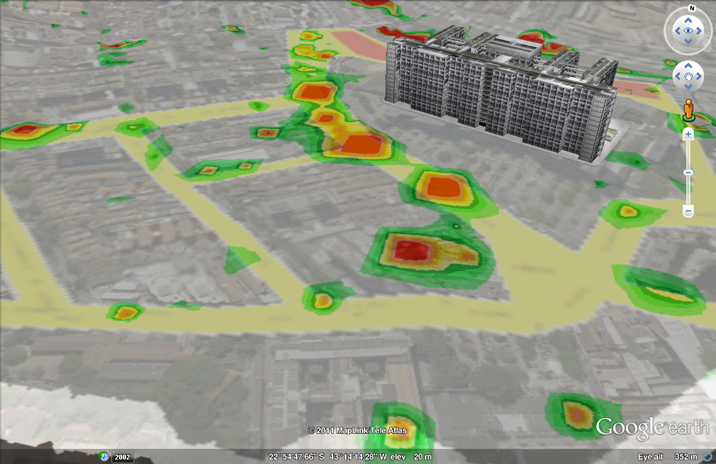
The results of each model-based forecast are provided to the City Government via a web portal in their command center, which has been dubbed in Portuguese as ‘Previsão Meteorológica de Alta Resolução’ (High-Resolution Weather Forecast), or PMAR.
It includes HDTV-resolution animations of various two- and three-dimensional visualizations of key weather variables, specialized meteograms at locations of key landmarks, weather stations, etc. within the city and detailed tables of weather data at those locations.
All of the web-based content contains information every 10 minutes of forecast time for each 48-hour model run. The visualizations are customized to the model configuration and the requirements of the end users. They also incorporate data from the city’s geographic information system.
 To comprehensively validate the precipitation forecasts, specific metrics were developed using hourly rain gauge data from the aforementioned and other sensor networks.
Several different metrics were evaluated and applied. The current methodology is based upon the analysis of multi-categorical contingency tables, whose categories are based upon thresholds of precipitation rates that relate to impacts on city operations (i.e., flooding).
In parallel with the verification effort, reassessment of the model configuration and input data was also conducted in 2013. In particular, the underlying surface and boundary layer physics have been improved by leveraging a diversity of remotely-sensed land use, soil and vegetation data, including stable operation of an urban canopy model. This has led to further improvement in the forecasting skill for strong convective events during the summer rainy season.
 A feasibility study was done to understand the flooding conditions and the quality of relevant data for the city, including 1m resolution terrain derived from LiDAR data, and maps of soil type, land use and city structure.
Little digital drainage data were available, which limits the creation of an accurate flooding model for the city. Very good historical flooding data were available, and the city has catalogued at least 232 recurrent points of flooding. These data only record the location and approximated peak time of flooding.
At a few sites, the peak flooding polygon has been mapped for particularly severe events. Neither detailed streamflow measurements nor an urban system drainage model were available. Using the limited historical data, a simplified high resolution-analytical model was developed for flood prediction. It takes into account geomorphological data and historical data. A mathematical model was implemented simulating surface flow and water accumulation using a locally conservative approach by employing the shallow water equations. It employs precipitation estimates generated by the aforementioned WRF-ARW configuration, which are used to analyze if a site historically prone to flood could receive a surface runoff flow that leads to flooding.
This coupled model approach to enable highly accurate and precise, operational forecasts of severe weather events has shown to be feasible for Rio de Janeiro. It has enabled the City Government to better anticipate and plan for the storm impacts on local infrastructure.
However, there are still several challenges to be addressed related to forecast verification, operational-driven visualization and interpretation techniques, specialized metrics for operational impact assessment, the quality of available data for the model’s initial conditions, and the choice of optimal configuration of the physics schemes.
For more info, visit Lloyd at the AMS (Wednesday, 5 February 2014, 4:15 PM).
- post co-authored by: P. Cipriani and A. P. Praino (IBM Thomas J. Watson Research Center, Yorktown Heights, NY, USA), R. Cerqueira, M. N. D. Santos, V. C. V. B. Segura and I. C. Oliveira (IBM Brazil Research Laboratory, Rio de Janeiro, Brazil), L. C. V. Real and K. Mantripragada (IBM Brazil Research Laboratory, São Paulo, Brazil), P. Jourdan (Centre of Operations, Rio de Janeiro, Brazil).
January 10, 2014 at 18:41
Thanks for the nice posting, Lloyd. I think the community would also be interested to see a link to some of the verification analysis for this event, when it is available, and to hear more about how the city government applied the forecasts toward decisions.