Short-term optimization of a tropical hydropower reservoir operation using deterministic and ensemble forecasts
Contributed by Fernando Fan, member of the LSH Research Group Guest Columnist Team
As we said in previous posts, hydropower is the most important source of electricity in Brazil and it is subject to the natural variability of water yield. Its extremes lead to the risks of power production deficits during droughts, and to safety issues in the reservoir and downstream river reaches during flood events. One building block of the proper management of hydropower assets is the short-term forecast of reservoir inflows as input for an online, event-based optimization of its release strategy.
While deterministic forecasts and optimization schemes are the established techniques for short-term reservoir management, the use of probabilistic ensemble forecasts and stochastic optimization techniques is receiving growing attention. In a recent work (Fan et al., 2016), we showed some hindcasting and closed-loop control experiments for a multi-purpose hydropower reservoir in a tropical region in Brazil.
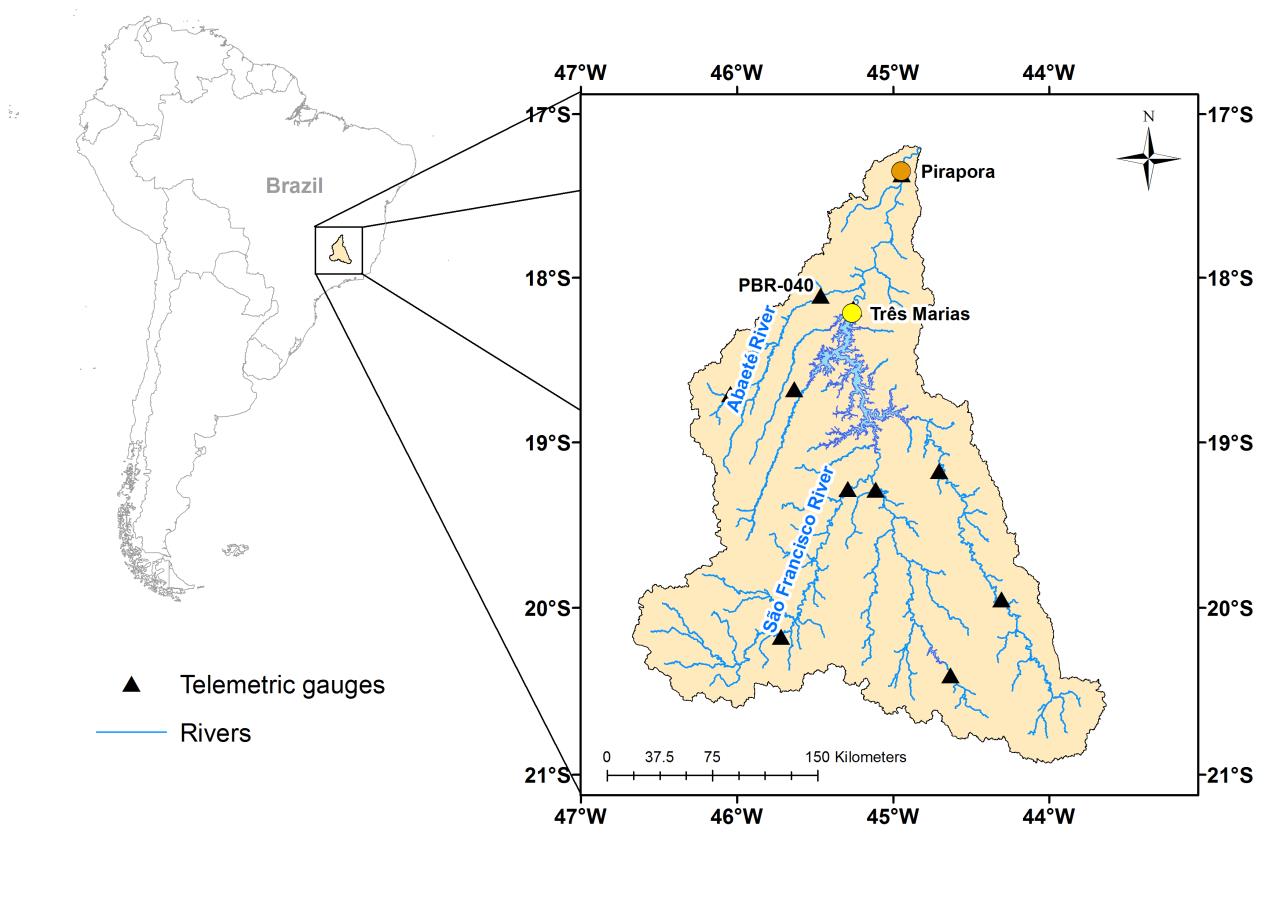
Fig. 1: Location of the Três Marias basin
The case study is the hydropower plant of Três Marias, located in southeast Brazil (Fig. 1). The reservoir is operated with two main objectives: (i) hydroelectricity generation and (ii) flood control downstream of the dam (at the City of Pirapora).
In the experiments, precipitation forecasts based on observed data, deterministic and probabilistic forecasts are used in a hydrological model to generate streamflow forecasts over a period of two years (Fig. 2).
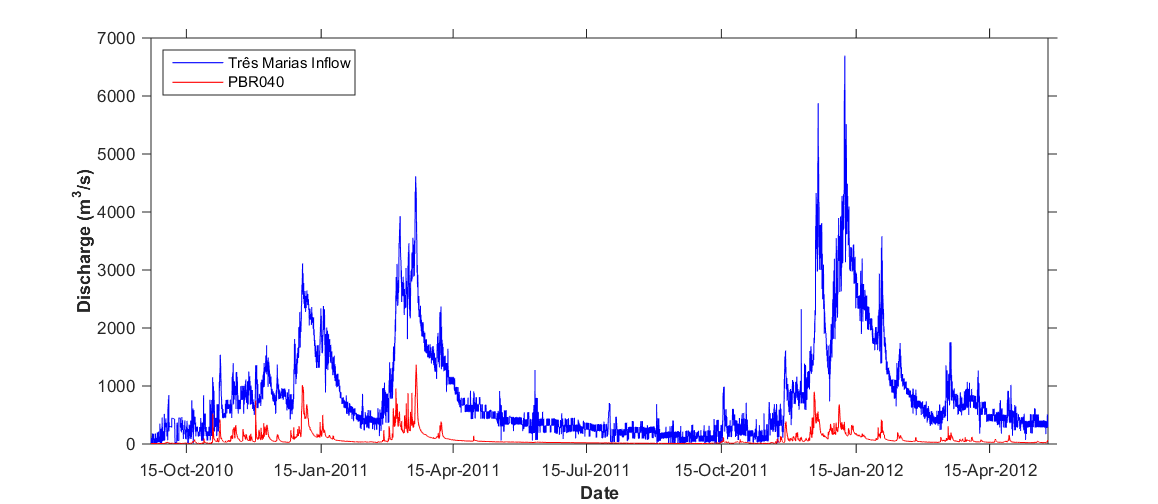
Fig. 2: Data used in the 2-year period experiment
The online optimization depends on a deterministic and multi-stage stochastic version of a model with a predictive control scheme in combination with a novel scenario tree reduction technique.
Results (Figures 3 and 4) for perfect forecast show the potential benefit of the online optimization and indicate a desired forecast lead time of 30 days (blue-dots). In comparison, the use of actual forecasts with shorter lead times of up to 15 days shows the practical benefit of actual operational data (black-dot).
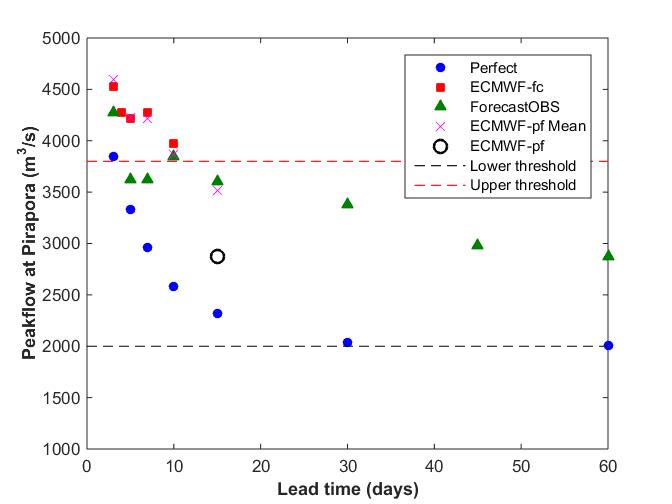
Fig. 3: Peak flow at Pirapora (results from the optimization using different input data and multiple lead-times for the forecasts)

Fig. 4: Volume over the 2000m³/s flooding threshold at Pirapora (results from the optimization using different input data and multiple lead-times for the forecasts)
It also appears form our results that the use of stochastic optimization combined with ensemble forecasts leads to a significantly higher level of flood protection without compromising the energy production (Figure 5).
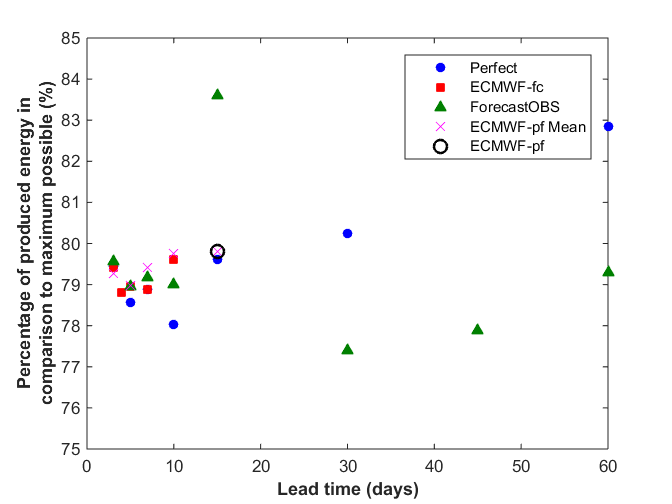
Fig. 5: Energy generation (results from the optimization using different input data and multiple lead-times for the forecasts)
Do you want to know more about these results?
- Please, check the following paper for more details: Fan, F. M., Schwanenberg, D., Alvarado, R., Reis, A. A., Colloschonn, W., Naumann, S. Performance of Deterministic and Probabilistic Hydrological Forecasts for the Short-Term Optimization of a Tropical Hydropower Reservoir. Water Resources Management, p. 1-17, 2016.
0 comments