Expect the unexpected: Flash floods in Northern Colorado September 2013
Contributed by Fredrik Wetterhall, Linus Magnusson and Ivan Tsonevsky

Source: CNN.com
On Monday 9 September, rain started falling in northern Colorado, breaking a long warm spell. When the rain finally stopped a week later, Boulder had received 448 mm (17.6 inches) of rain, with the 12 September as the wettest day with 230 mm, a value that is unprecedented in historical records. The latest estimate is that the flood was likely a 100-year event.

Figure from http://www.climatecentral.org/. Accumulated rainfall in inches for the wettest and driest years for Boulder, with yellow showing this year’s precipitation
The event was unexpected and disastrous, killing at least 8 people and destroying or damaging thousands of homes. The economic losses of the event are estimated in the order of $2 billion, and a substantial part of these losses was uninsured.
Atmospheric conditions that led to the event
A preliminary analysis of the reasons for the development of such an extreme situation points to a combination of a very stationary synoptic situation causing the weather systems to “park” over the area, and secondly very moist air coming up from the south, which can be referred to as an atmospheric river. The extreme rainfall was a combination of precipitation caused by orographic lifting plus convective storms.

Figure showing water vapor images from the GOES-15 and GOES-13 weather satellites. (Animation: Cooperative Institute for Meteorological Satellite Studies)
How well was the event forecasted?
ECMWF predicted the general precipitation pattern but the maximum in the Boulder area was underestimated. For the longer forecast ranges, the precipitation pattern was present but still the amplitude was underestimated.
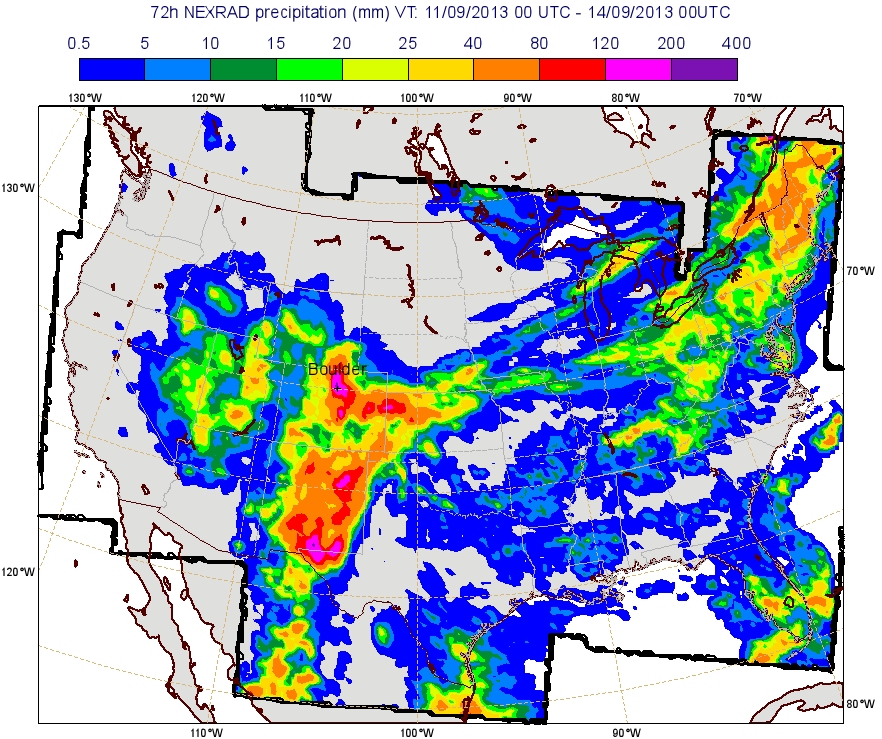
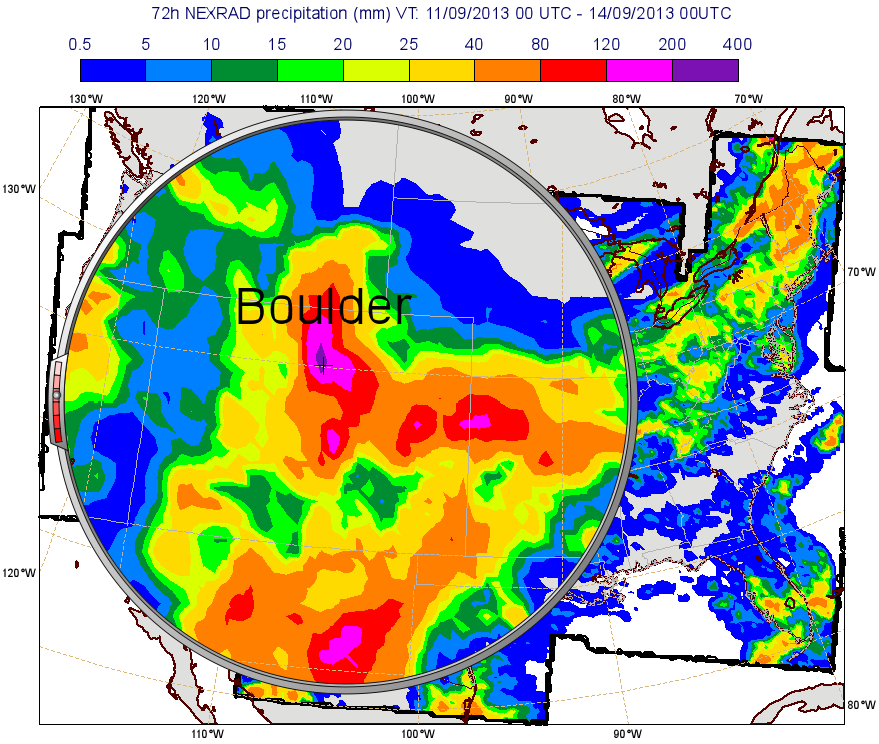
The figure shows the accumulated precipitation from the NEXRAD product, for the period 11-13 Sept. In the right panel the area around Boulder is zoomed in. The maximum precipitation from NEXRAD was more than 200 mm for the 3-day period
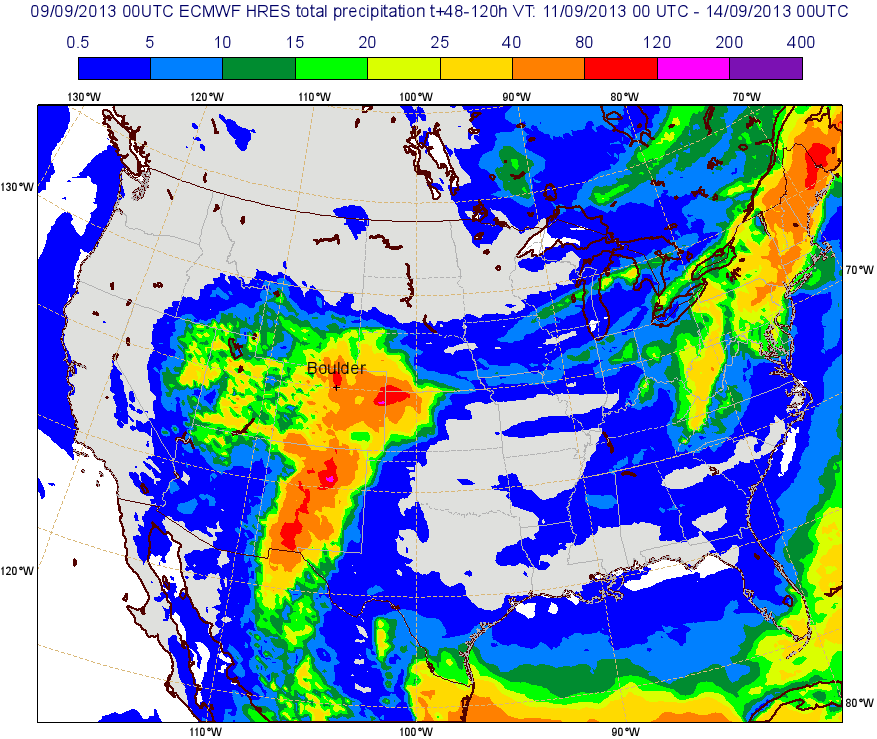
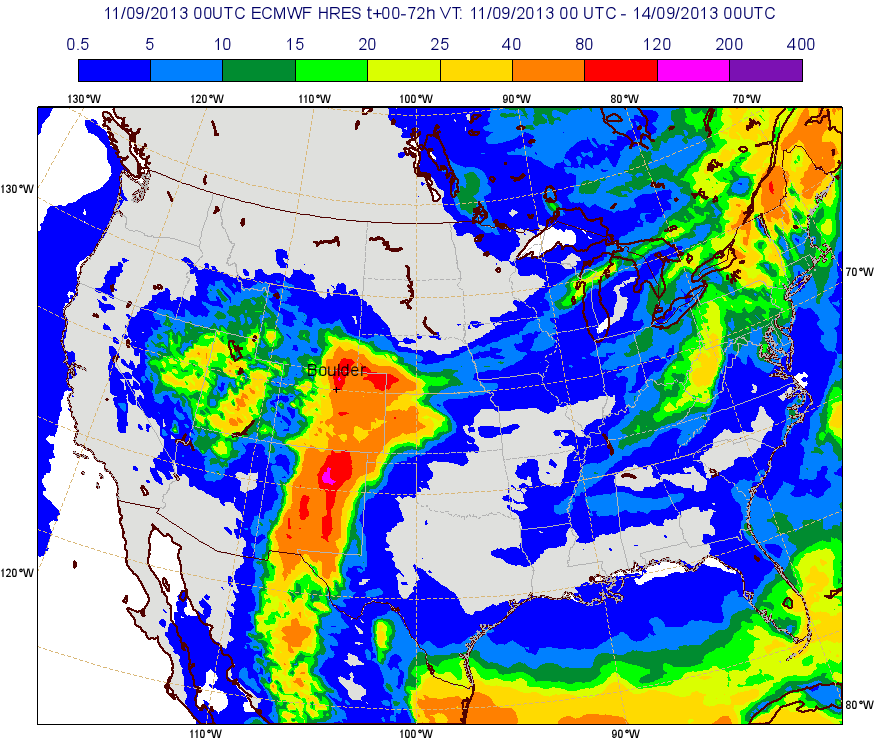
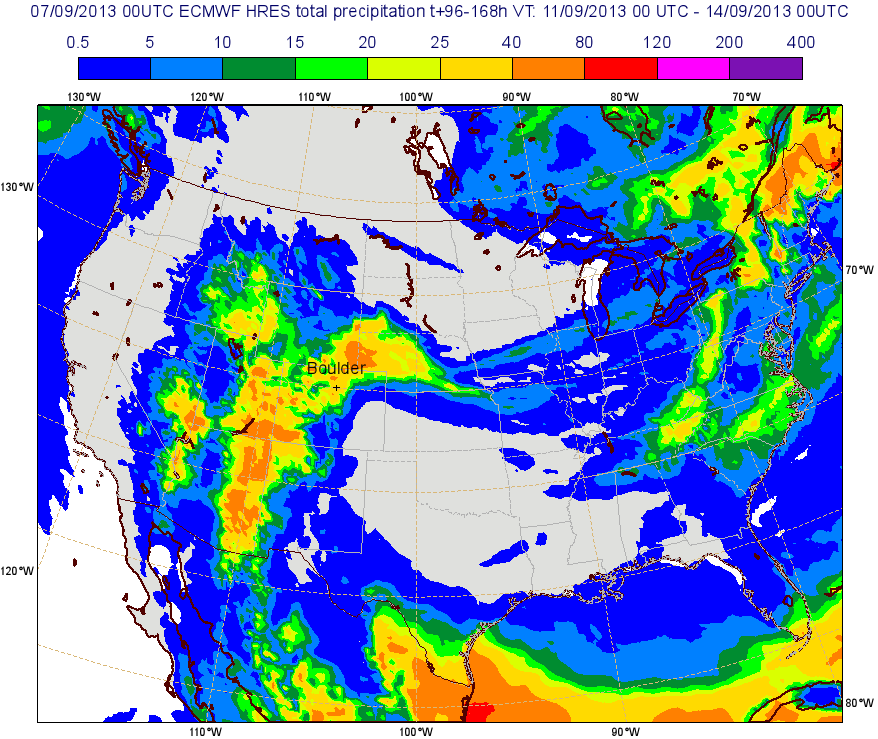
The figure shows accumulated precipitation from the high resolution forecasts for the same period as the NEXRAD product. The right panel forecast from 7 September (4-7 day forecast), the mid panel from 9 Sept 00 UTC (2-5 day forecast) and the left panel shows the forecast from 11 Sept 00 UTC (0-3 day forecast).
Even though the model underestimated the severity of the event in terms of absolute numbers, it can still give a heads-up that an extreme event is to be expected. A modeling system like the ECMWF ensembles system also creates forecast for past events, which are known as hindcasts. From these, a weather situation can be looked at as how unusual it is in comparison with previous climate, and an Extreme Forecast Index (EFI) can be calculated. The figure below shows the EFI for the total rainfall over three days (Wed 11-Fri 13).

Extreme Index forecast (EFI) for 3-day total precipitation for the forecast from 11 Sept. 00 UTC.
The area in red indicates the regions where extreme rainfall is very likely while the black contours show the magnitude of the severity of the event (the larger the values the more severe rainfall might happen.
Is there a lesson to be learned?
In this case the forecastswere able to point to a correct location of extreme precipitation, but not to the amounts that were received. There were forecasts of heavy rain, but none of the forecasts could predict the severity of the event. The situation bears some similarity to the flooding in Alberta, Canada and Europe earlier this summer, and the work is now ongoing to analyse whether these situations can be better predicted or not with existing tools.
Even if the forecasts had spot on it, it is not certain that the rescue work would have been more successful. Or, as Boulder police Chief Mark Beckner stated: “What we had always trained on and practiced on and talked about, was, ‘What if a cell sets up over Fourmile, or Boulder Creek, and dumps 6 inches of rain in an hour? Here’s what to expect. But the scenario we had was that the whole region was getting dumped on.”
This was not the first time in recent memory that Colorado was hit by flooding, and each time it has led to changes in how risks are minimized. It is too early to know how this event will lead to improved measures of safety, but it emphasizes the need for tools to predict severe events and training in how to react in these situations. The Boulder flooding of 2013 produced a number of heroes that acted without thinking of their own safety to save other people’s lives, but even so there where casualties. One of the lessons to be learned is surely that we have to live with the knowledge that it can and will happen again and what measures to take when it does. As flood forecast developers this should spur us on to better improve our forecasts and with them improve how they can be used to take action next time the unexpected happens.
For more links on the event, see below:
http://www.youtube.com/watch?v=d981JFSWOiY
http://news.ca.msn.com/top-stories/colorado-disaster-what-is-a-100-year-flood-its-not-what-you-think
http://www.cbc.ca/player/News/TV+Shows/The+National/ID/2406723569/
September 27, 2013 at 17:31
My experience is that atmospheric models tend to underpredict large precipitation events and overpredict small ones. The relationship between predicted and observed precipitation can be highly non-linear.
So it may be interesting to compare precipitation hindcasts of these events with what actually happened. Also, because the uncertainty in precipitation forecasts is space and time scale dependent as well as lead-time dependent to the beginning of the event, it may be interesting to do this analysis for events of different durations, area sizes and lead times.
September 27, 2013 at 20:46
Thanks for the nice post. The description of the situation and the information available show well the importance of the event. One of the links at the end of the post shows an impressive video, with an operator opening in extremis, and using his own hands, a gate for flood control. Even with all the automatic procedures in the forecasting chain, automatic controls and decision support systems, it seems that reality can sometimes be very different and humans have a key role to play in the flood response chain.
As suggested by John, it would indeed be interesting to have details on hindcast analyses, if any available, providing information on how precipitation was captured in space and time. Maybe someone from the HEPEX community has information to add here?
More qualitatively speaking, I am also curious to know how forecasters (meteorological and hydrologic forecasters) experienced the event as it was approaching; if it made them think of an analogous past event, for instance. The views and perceptions they had in real-time may also contribute to the process of improving hydro-meteorological forecasts.
September 30, 2013 at 12:36
@John and Maria-Helena. There is currently an ongoing analysis looking more into details regarding this and other similar events, as also was hinted in the post. It seems like the event was well predicted in time and place, but not in magnitude. If this is because the models are too coarse to yet capture these events, or whether there is something else missing in the models are questions that we will try to answer.
Hopefully there will be a new blog post with the analysos by the end of this year!
October 1, 2013 at 01:18
I’ve come across many cases like the above where, say, the precipitation forecast magnitude was too low, but the Extreme Forecast Index was very high for an extreme event. I’m curious if false alarms are also a common issue, i.e. the forecast was very high but the observed was not.
It seems like it could be one of two cases… 1. For as much as the model underforecasts extreme floods, it is capable of equally large over-forecasts of extreme events. Not much can be done about this kind of error (true?) or 2. The observed goes up to 100 mm, but the forecasts have never been more than 30 mm. In this case you could do some post-processing to stretch the precipitation forecasts (make the lows lower, highs higher).
Put another way, is this underforecasting a routine conditional bias?
October 4, 2013 at 14:37
Underforecasting heavy precipitation, i.e. a bias in the mean sense conditional upon observed precipitation amount, is characteristic for several reasons.
First, it’s important to note that a climatological probability forecast is, by definition, only unconditionally unbiased and conditionally biased. In other words, when forecasting with a model that lacks skill (such that the forecasts resemble climatology), the forecasts will be conditionally biased, by construction. This is why long-range forecasts invariably have large conditional biases for heavy precipitation.
Second, whether physically-based, statistical or some combination of the two, models tend to have an averaging or smoothing effect for extremes, since the parameters are generally estimated to be optimal in some unconditional sense or for a mix of unconditional and conditional properties. This is understandable because they must be used for a range of applications.
Thirdly, there are limits to what can be achieved through statistical post-processing. Recall, that a post-processor aims to estimate the probability distribution of the observed variable conditionally upon some predictors, such as the “raw” forecast precipitation. Remember, if the raw predictors lack skill, the post-processed probability distribution will resemble climatology. Put simply, if the raw forecasts cannot “see” a heavy precipitation event, the post-processor does not know to correct as though a heavy precipitation event is occurring.
One can always estimate parameters so that the model performs better conditionally, i.e. for heavy precipitation, but this inevitably comes at the expense of unconditional bias. Really, the best way to improve performance for heavy precipitation is to improve the modeling of physical process that are important for heavy precipitation (e.g. convection), whether through discretization or process description (so, I agree with what Fredrik was alluding to). Afterall, the physical processes that give rise to extremes are often materially different than “average” conditions (there are many examples of this from many disciplines). Some improvements might also be expected through improved statistical modeling. So, a combined dynamical-statistical approach may bear fruit, but one cannot expect much in the absence of raw predictors that are skilful.
October 7, 2013 at 18:34
Thank you for sharing this important event. Having a look here I was wondering “How the forecasters experienced the event? How was the behaviour of forecast 1, 2 o r 3 days before (increasing, decreasing, stable?), and about chatchments and discharges!