Do deterministic weather forecasts have to be physically realistic?
Contributed by Anders Persson, a HEPEX guest columnist for 2014
This seemingly naïve question is prompted by a comment by Tom Pagano to my last column. It goes to the heart of what weather forecasting is about.
It is true that computer made deterministic weather forecasts (ECMWF’s T1279, GFS, ALADIN etc) must be physically realistic. One of the tasks of the monitoring at ECMWF is to make sure that the deterministic forecasts are physically realistic. A 10-day forecast map should appear as realistic as a 1-day forecast map or an analysis.
But post-processed, refined or “tailor suited” deterministic weather forecasts do not have to by physically realistic. One of the major problems in today’s weather forecasting is that this distinction is not understood or upheld.
Assume the deterministic NWP model predicts that low clouds will clear and the 2 m temperature will drop from +2°C to -4°C (figure 1). The forecasters are now supposed to justify their existence by “adding value” to the NWP by modifying it using their experience, physical understanding or knowledge about NWP models.
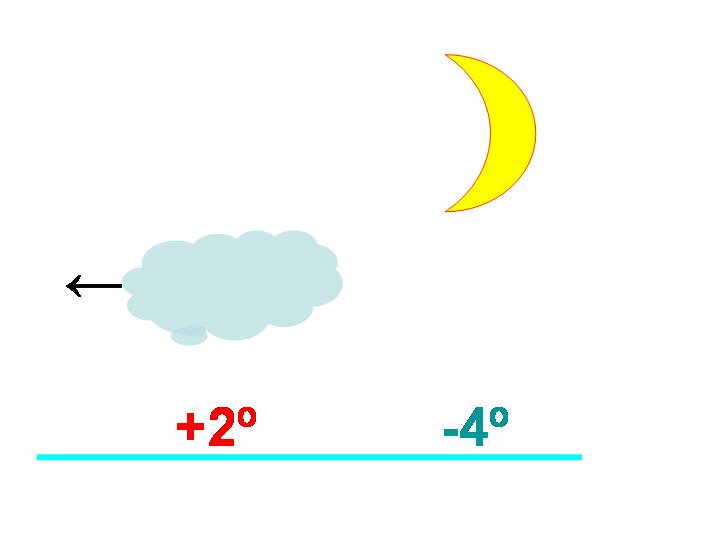
Figure 1: There are only two physically realistic forecasts possible, either overcast with low stratus and +2°C or clear skies with -4°C.Which one should a clever forecaster choose – or any of them?
This works well when the NWP model has clear systematic errors, but becomes more and more difficult with the steady model upgrades. But the forecasters can do something else: they can question the clearing itself!
They might, for example, assign only a 40% probability that the clouds will disperse and the temperature drop to -4°C and assign a 60% probability that it will stay cloudy with +2°C. Weighted together this yields -0.4°C (or rounded off to ±0°C) as a “most likely” or, if you want, “most tactical” temperature forecast. This is the ideal number to put in the verification form.
The ±0°C forecast might also be given to the public, via newspapers, radio or TV stations. But the consequences for the public of a temperature drop below zero are often greater than if it stays mild. For this reason, the forecasters might tweak their ±0°C forecast into -1°C (or perhaps even -2°C).
None of these ±0°C, -1°C or -2°C values will never verify (or only for a very short time), it will either be +2°C or -4°C. The forecasts are indeed unrealistic. But their quality does not lie in “how very good” they are, but “how little bad” they are. Instead of trying to make the 100% perfect prediction, the forecasters have tried to minimize the expected forecast errors. By doing this, they have not acted as physicists but as “intuitive statisticians”.
What the forecasters did was for the ±0°C forecast they used (intuitively at least) an optimal least square approach in order to minimize the Root Mean Square Error (RMSE). This approach will in the long run beat the deterministic NWP!
The RMSE assumes implicitly a symmetric cost or penalty function: negative errors are seen as bad as positive errors (figure 2, left). In this case RMSE regards it as equally bad to miss the frost as to issue a false alarm. The RMSE is “objective”.
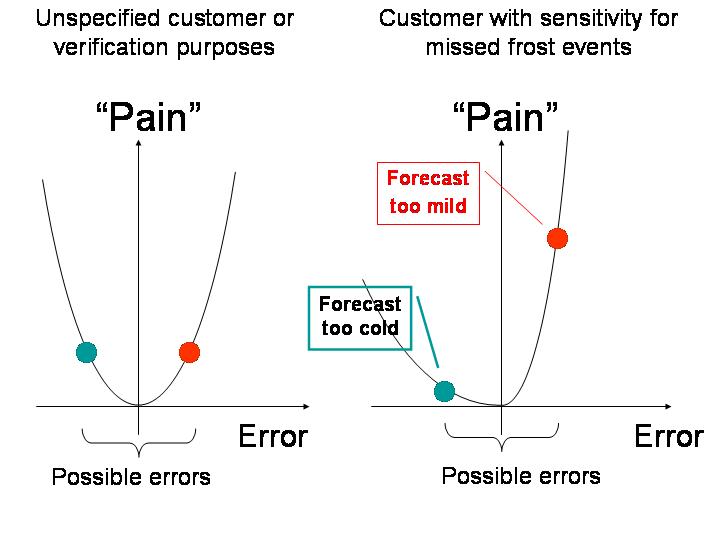
Figure 2: Cost or penalty functions for the general, all purpose situation when a missed even is as bad as a false alarm (left) and for the specific situation when the public or customers are more affected with a missed event than a false alarm.
When the forecasters issued the -1°C or -2°C forecasts they (intuitively at least) applied an asymmetric cost function (figure 2, right) where “missed events” (forecast too warm, i.e. positive errors) are considered worse than “false alarms” (forecast too cold, i.e. negative errors). This deviation from “objectivity” will be slightly punished by the RMSE, but still not as much as for the +2°C or -4°C forecasts where RMSE will be either zero or very large.
But this approach seems to have catastrophic consequences.
As an example, I use the the same scenario as in my reply to Tom’s comment: Ships leaving the Swedish waters heading for North America have to make a choice of either passing north of Scotland or through the English Channel.
Mostly, the meteorologists involved in ship routing can give them good advice at an early stage. But, as one of my critical colleagues once pointed out: if the weather situation is tricky and the odds are equal for either route – would the ships then, by a meteorologist following your philosophy, be sent on an intermediate route straight into Newcastle harbour?
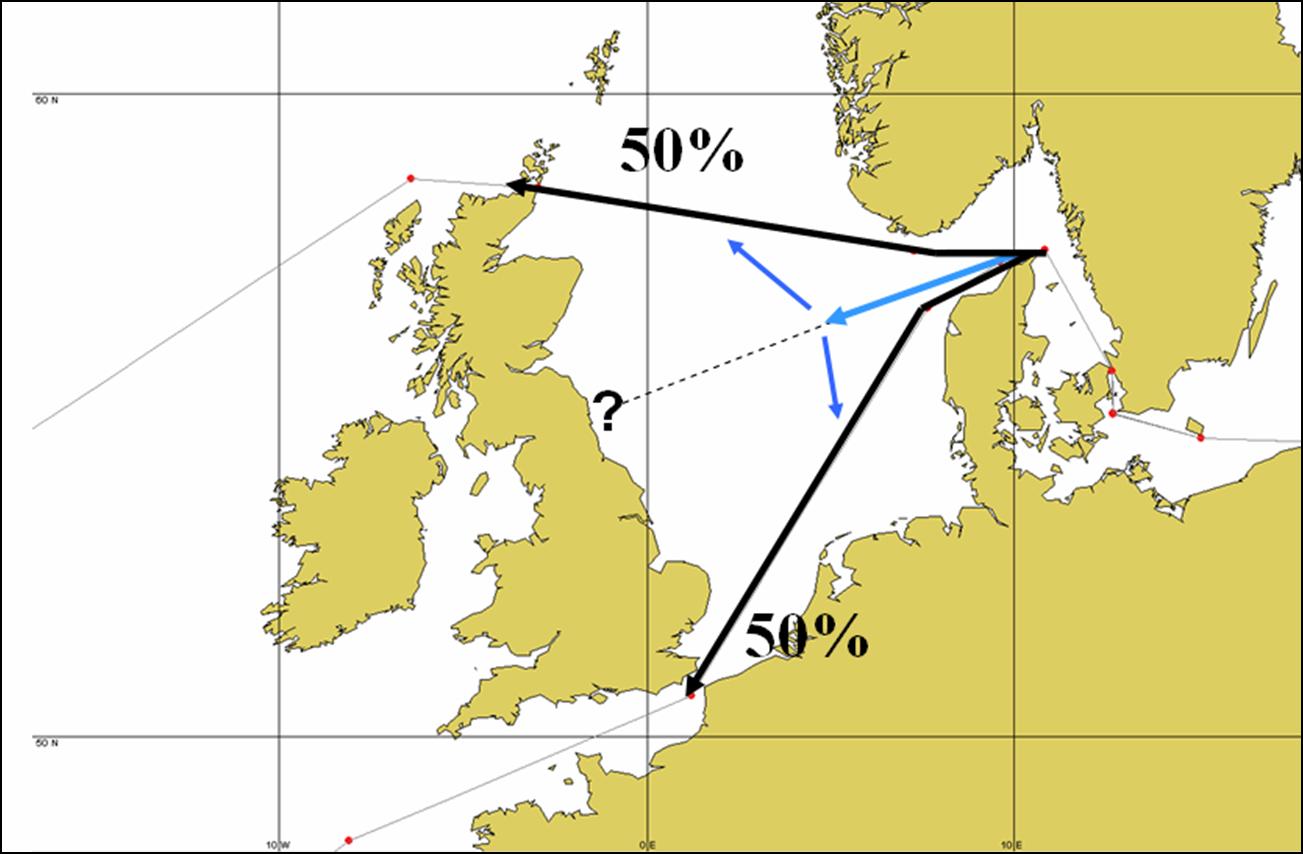
Figure 3: Ship leaving the Swedish waters heading for North America can choose either to go north of Scotland or through the Channel, but possible not via Newcastle!
I was really floored by this objection and saw my whole forecast philosophy in tatters. It would not only result in physically unrealistic statements, but hundreds of sunken ships and drowned sailors in Newcastle harbour!
But Jan-Erik, one of our most experienced ship routing meteorologists, told me: -This is exactly what we would do in such cases – we direct the ships towards Newcastle. We would, however, do this as a temporary measure, for the captains to await later forecast information. Switching from some “middle course” route to one of the “realistic” routes is on average less costly than to switch from one extreme to the other (figure 3).
The problems mentioned above will evaporate if the forecasts are issued in probabilistic terms. However, traditionally educated meteorologists will of course find these even more “physically unrealistic”. As one told me: -We don’t live in a quantum world like Schrödinger’s cat, but in a world where there is either “frost” or “no frost”, never “40% frost”.
So there are more issues to come back to . . . .
Next post: 18 July 2014.
 Anders will be contributing to this blog over the year. Follow his columns here.
May 23, 2014 at 18:32
Great posting — the discussion really highlights the inherent drawbacks of making a deterministic forecast for an uncertain outcome. We do this as a matter of convenience, constrained by the limitations of our computing environments, resources and models (including decision models). In the case of the QPF used in hydrology, uncertainty over the location, timing and magnitude of future storms leads to a single QPF that is forced to compromise in all three dimensions. The resulting QPF is ‘smeared’ spatially over much larger areas than a realistic storm system would impact, over longer time intervals, but at much lower than realistic intensities. By construct, it is almost designed to be wrong, and the consequences when used for flood forecasting, especially in big events, are never surprising (think of the Nashville floods, or the Calgary floods … and on and on). Ensemble approaches are the obvious way out of this cul-de-sac, though they require a major re-engineering of our flow forecasting infrastructure and a rethinking of the downstream decision process. Fortunately, as I think the HEPEX Workshop will show, we’re getting there! -Andy
May 23, 2014 at 20:40
Thanks Andy,
But as I have tried to make clear, and try to continue to make clear, uncertainty estimation or probabilities did not enter the limelight when the ensemble forecasts were invented fifteen years ago in the early 90s – they had been on the agenda since the turn of the century promoted by the American Cleveland Abbe and the Swede Anders Ångström.
They were still on the agenda until 1980 when a sort of paradigm shift occurred – numerical weather prediction (NWP) models were able to produce ten days ahead seemingly accurate and detailed deterministic forecast of temperature, wind, precipitation for every ten minutes and with decimals!
Even if the ensemble forecast would be killed off by some computer virus the need to express the uncertainty in one way or the other remains, in particular since the over detailed and over confident NWP makes people wonder how much they can trust all these details.
In my case the “ideal” forecast would have been: “±0°C with a 60% chance of +2°C and a 40% chance of -4°C°”. However, the meteorological community would not dare to complain about the probabilities, because they are “politically correct”, as about the deterministic ±0°C forecast because it is “physically unrealistic”.
But without the “physically unrealistic” ±0°C forecast, the probabilities would, as we say in Swedish, “hang in the air” and be rather useless.
May 25, 2014 at 11:43
An excellent post, as usual. In particular, I like the idea of heading towards Newcastle as an interim measure. Yes, forecasts are binary, but there can be value in delaying until better information is available.
That said, different ships will have different abilities to navigate the northern versus southern route. When the forecaster picks a single trajectory, he/she is assuming something about the users and their abilities. With a probabilistic forecast, maybe a weather hardened boat will go 80% north, 20% south (west northwest) whereas the weak boats prefer to go 80% south, 20% north (southwest). With a deterministic forecast to go down the middle, everyone is sub optimal.
If you serve one customer and know them well, then the deterministic forecast is fine because it takes some workload off the user. But if you shout your public forecast across the landscape, who knows which canyons it will echo through?
May 26, 2014 at 10:01
Nice post. However it considers the meteorological forecast to be a final output (or decision criteria). Andy has already mentioned the hydrological practice concerning the QPF input to hydrological forecasting models (BTW the QPF is smeared over the large area with lower intensities but hydrological model often multiplies the QPF input by some adjusting parameter).
Anyway, how about the following application (lets say hydrological model) using three inputs from NWP (most likely QPF, temperature, humidity)? We can correct the QPF based on the meteorologist/forecaster’s interpreation of NWP forecast but how to ensure the physically realistic connections of all variables?
It is even more tricky in climate change impact scenarios GCM/RCM outputs are transformed to fit the observation (quantile transformation are the most common) for each parameter separately. The question is it physically realistic? Definitely not … Is it applicable and justifiable?
May 30, 2014 at 11:56
You are absolutely right. Assume that only rain and temperature are of interest. Then the deterministic forecasts can only be some quantity where the error is minimized according to some norm. But this only works for end users which are concerned EITHER by temperature OR rainfall, not by both at the same time. Then I cannot see any other alternative than probabilities for different combinations of temperature and rainfall (30% prob for <0 C and <2 mm/24 h etc.)
You already meet this problem in my example. With +2C or -4C as the only possible outcomes there should be no risk of slippery roads as with ±0°C. But a forecast of ”zero degrees and no risk of slippery roads” would not be taken seriously.
May 28, 2014 at 00:28
It appears to me that problems are introduced once forecasters take into account consequences of (decisions based on) forecasts. Would it maybe best if they (we) would stick to our own trade?
May 30, 2014 at 11:59
What is really “our trade”? Is it to restrict ourselves to a contest with the Computer?
During my time as forecaster some colleagues argued that our job was to show our skill by, in situations like the one above, cleverly choose between the physically realistic +2°C or -4°C forecasts and thereby, in the long run, show that we were “better” than the computer. They didn’t like ”my” approach (=providing the best decision value forecast to the end users even if it was “physically unrealistic”). It was “cheating” in their view.
You are indeed right “that problems are introduced once forecasters take into account consequences of (decisions based on) forecasts.” But that’s why we are here – to come up with good solutions!
July 2, 2014 at 11:06
Thanks also for the interesting post! I just would like to add an interesting example when it comes to the question what role the forecaster should play: In Switzerland, there are regular complaints by the tourist offices of the Valais areas because of locally too pessimistic weather forecasts during the ski season, especially during the weekends (which, they claim, results in an economic loss). Obviously, the forecaster plays a very important role here and I think that critics from the end users might well be justified if the forecaster is not willing to provide forecasts that consider possible consequences.
July 2, 2014 at 13:20
Bettina: This is a classical problem, perhaps dating back to when the first weather forecasts were produced in the 1860’s. The forecasters are haunted by (at least) two demons: to miss an event and not be liked.
1. To have missed a rain/snow occurrence is seen as more negative than to have issued what turned out to be a false alarm. A forecast of “showers” or “local showers” is seen as successful if at least one station confirms it. But “local” can mean anything from 50% to 1% of the region. If for example only 10% of the region is at risk, perhaps it would be better, in the public forecasts, not to mention showers at all?
2. Another demon, counter-acting the first, is the popularity demon. If the weather is and has been very unsettled for a long time (as indeed has been the case here in Sweden) the forecasters are under pressure to look for the “silver lining”. For example: “-A weak ridge of high pressure just to the west m i g h t extend s l i g h t l y into our region and in t h a t c a s e the clouds will m o s t l i k e l y break up and even give s o m e sunshine.” The public’s reaction is of course: -Wonderful news Anders!
I had for my imminent column planned to write about the way the data assimilation in the numerical models handle weather observations (not at all), but perhaps I should instead repeat one of my talks at a recent conference in Madrid, the one listing “Seven ways to convey probability information without mentioning probabilities”.