Representative Direct Ensemble Uncertainty Visualizations: Conveying Uncertainty Using A Small Portion of The Data
Contributed by Le Liu, PhD., School of Computer Science Northwestern Polytechnical University.
As we know, ensemble approaches are widely adopted to estimate forecasts uncertainty. In atmospheric sciences, these approaches are specifically categorized into two types: multi-model ensembles and perturbed parameter ensembles. The former runs multiple numerical prediction models with the same initial parameters to estimate the atmospheric evolution, while the latter runs a single model multiple times with slightly perturbed initial conditions. They are usually combined to form the final forecast.
Visualizing forecast uncertainty is challenging: the example of hurricane forecasts
Accurately interpreting these complex ensembles plays a crucial role in making emergency decisions of an incoming hurricane: we have to prepare for a potential serious situation, but we do not want to over-prepared.
Visualization techniques, which represent data in a visual context to enhance data analysis, function as assets of comprehending forecast ensembles. However, developing effective visualizations portraying these ensembles incorporating uncertainty are challenging. This is because the ensembles are usually multidimensional, multivariate, multivalued, multimodal, and time series. For instance, the U.S. National Hurricane Center (NHC) generates ensembles of forecast tracks to study hurricane wind speed probabilities. Individual ensembles contain 1,000 time- and location-sampled predicted tracks for the next five days from the beginning of a forecast, and each sampled point is superimposed with hurricane predicted intensity as well as wind structure, which is defined as radii of the 34-, 50-, and 64-kt winds in the four ordinal directions. Portraying this complete information easily exhausts possible available visual elements, e.g. color, opacity, location, geometry primitives,etc., resulting in complex visualizations which are difficult to interpret. It is getting worse if additional information of the uncertainty needs to be annotated into the same display.
What’s the “cone of uncertainty”?… and what’s wrong with it?
Statistical summary displays are commonly used to address this challenge. This technique represents the data uncertainty using statistical characteristics such as mean, standard deviation, confidence interval, etc., and subsequently visualizes these values. For instance, the most widely adopted uncertainty visualization of hurricane forecast is the cone of uncertainty developed by the U.S. NHC, as shown in Figure 1. The most important component of this visualization is a semi-transparent white cone-like glyph used to depict a 67% confidence region of the predicted locations of the eye of the hurricane track. Even though this approach greatly reduces the information that needs to be displayed and provides a straightforward indication of the uncertainty, we have experimentally shown that this cone and its underlying statistical concept are easily mistaken (Ruginski et al. 2016). Specifically, an increasing in the size of the cone tends to be misinterpreted as an increasing in the storm size and intensity; and the cone is an inside-outside binary representation, possibly leading those outside of the cone to a false sense of safety, while those inside of the cone have an exaggeration of danger.
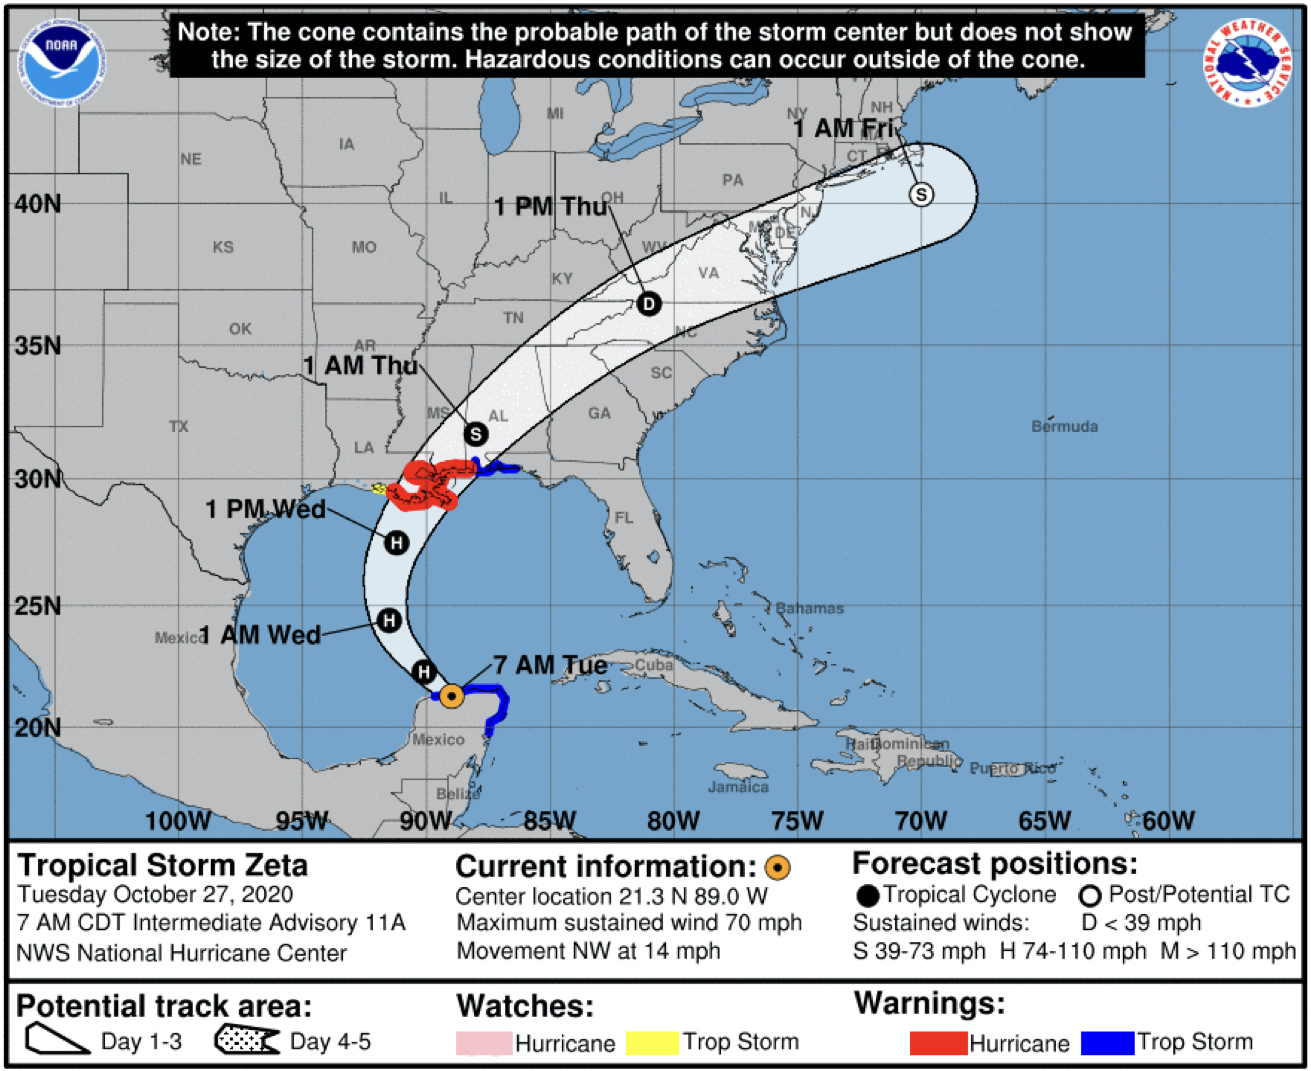
Figure 1. The U.S. National Hurricane Center cone of uncertainty visualization of Hurricane Zeta, 2020. Source: https://www.nhc.noaa.gov/archive/2020/ZETA_graphics.php?product=3day_cone_no_line
Direct ensemble uncertainty visualization: an alternative to the cone of uncertainty
Aiming at portraying this forecast more effectively, our group initialized a new line of research which implicitly depicts the uncertainty by directly visualizing ensemble members, which is referred to as direct ensemble uncertainty visualization. The very first work of this research was reported by Cox, House, and Lindell 2013. As shown in Figure 2, this technique produces an ensemble of hurricane predicted tracks in such a way that the statistical distribution of this ensemble closely matches that of the one implied by the U.S. NHC cone of uncertainty. These tracks are continuously generated and overlaid on top of another, the old tracks fade over time to prevent the visualization from being visually cluttered. Individual tracks are rendered with a semi-transparent blue and the opacity accumulates as tracks overlap one another over time, resulting in regions with a higher concentration of tracks that are more opaque than those with lower ones, indicating a higher degree of certainty of spatial predictions. Subsequent cognitive experiments have suggested that using this visualization significantly mitigates the viewers’ misconceptions of the spatial distribution associated with the prediction uncertainty, and thus, enhancing their emergency decision-making.
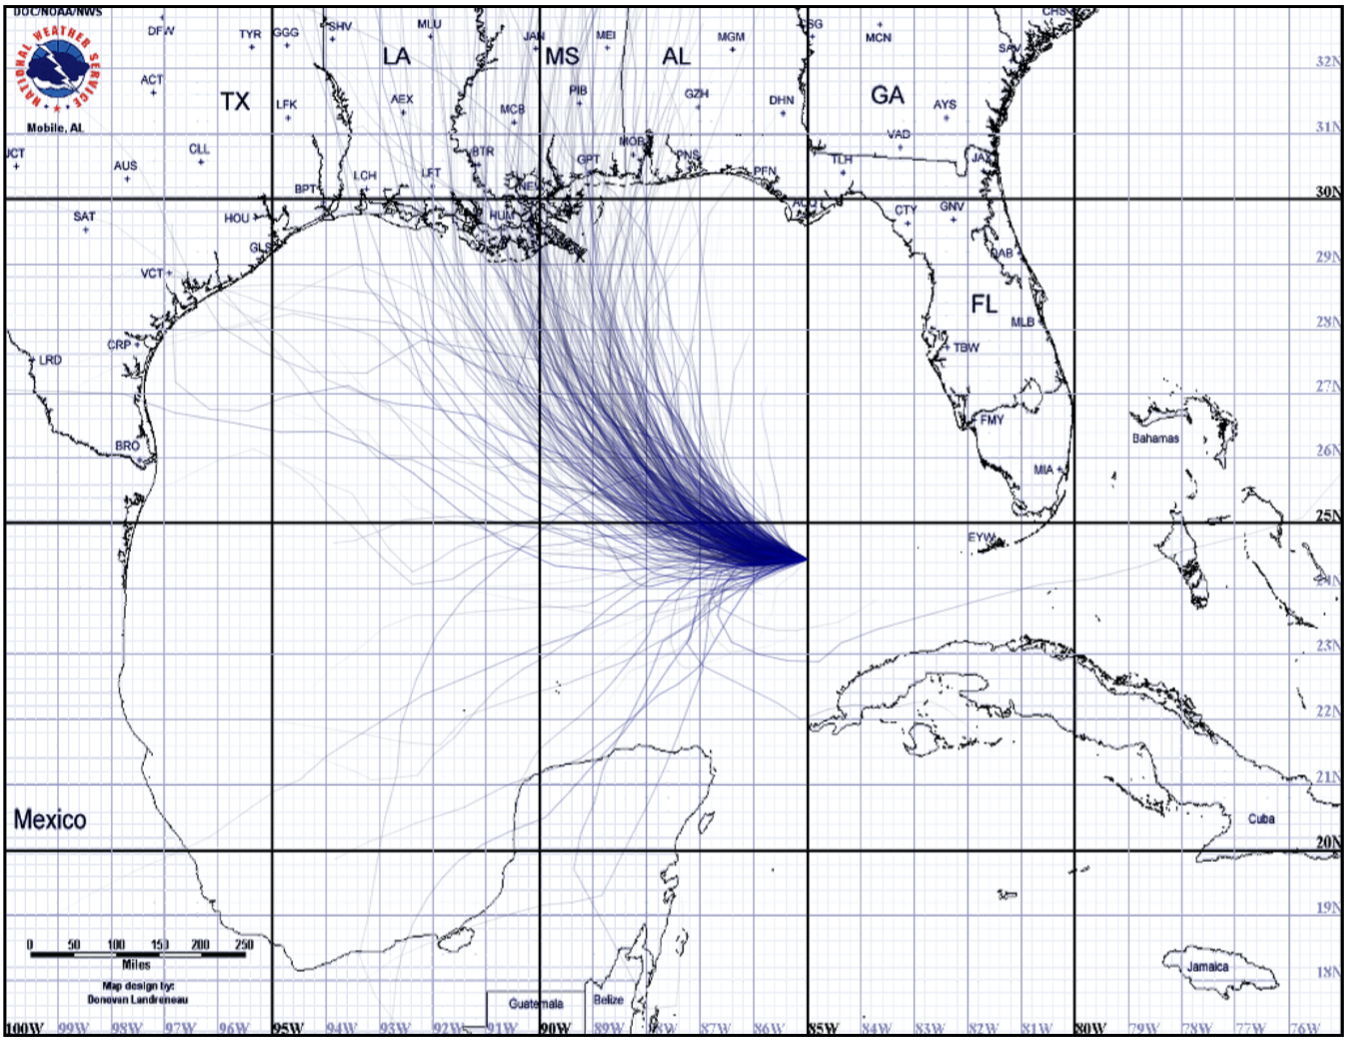
Figure 2: Example from direct ensemble display developed by (Cox, House, and Lindell 2013). : Hurricane Katrina at 10 AM CDT, August 27, 2012 (reprinted with permission)
When, where and how strong will it be?
While this visualization is promising in representing the overall spatial uncertainty, it fails to answer the crucial time- and location-specific queries such as “when and where the hurricane will land, and how strong will it be”. To address this limitation, we have proposed a representative direct ensemble uncertainty visualization (Liu et al. 2018). Instead of displaying the full ensemble, this approach first computes a small set of representative tracks which perverse the spatial distribution of the original ensemble in a certain level of confidence. Second, individual tracks are designed to maintain a minimal spatial separation between one another to avoid potential visual clutter in the visualization. Doing so provides us enough display space to annotate additional time- and location-specific storm characteristics, as shown in Figure 3. Particularly, the predicted storm intensities changing over the forecasting time are color encoded along predicted tracks. Circles are placed along the tracks at every 6-hours locations, where the radii of these circles are mapped to the time- and location-sampled predicted storm sizes. A following cognitive study has suggested that this visualization is effective in both reducing the number of tracks that need to be presented to convey the important uncertainty, and in conveying significant elements of storm risk.
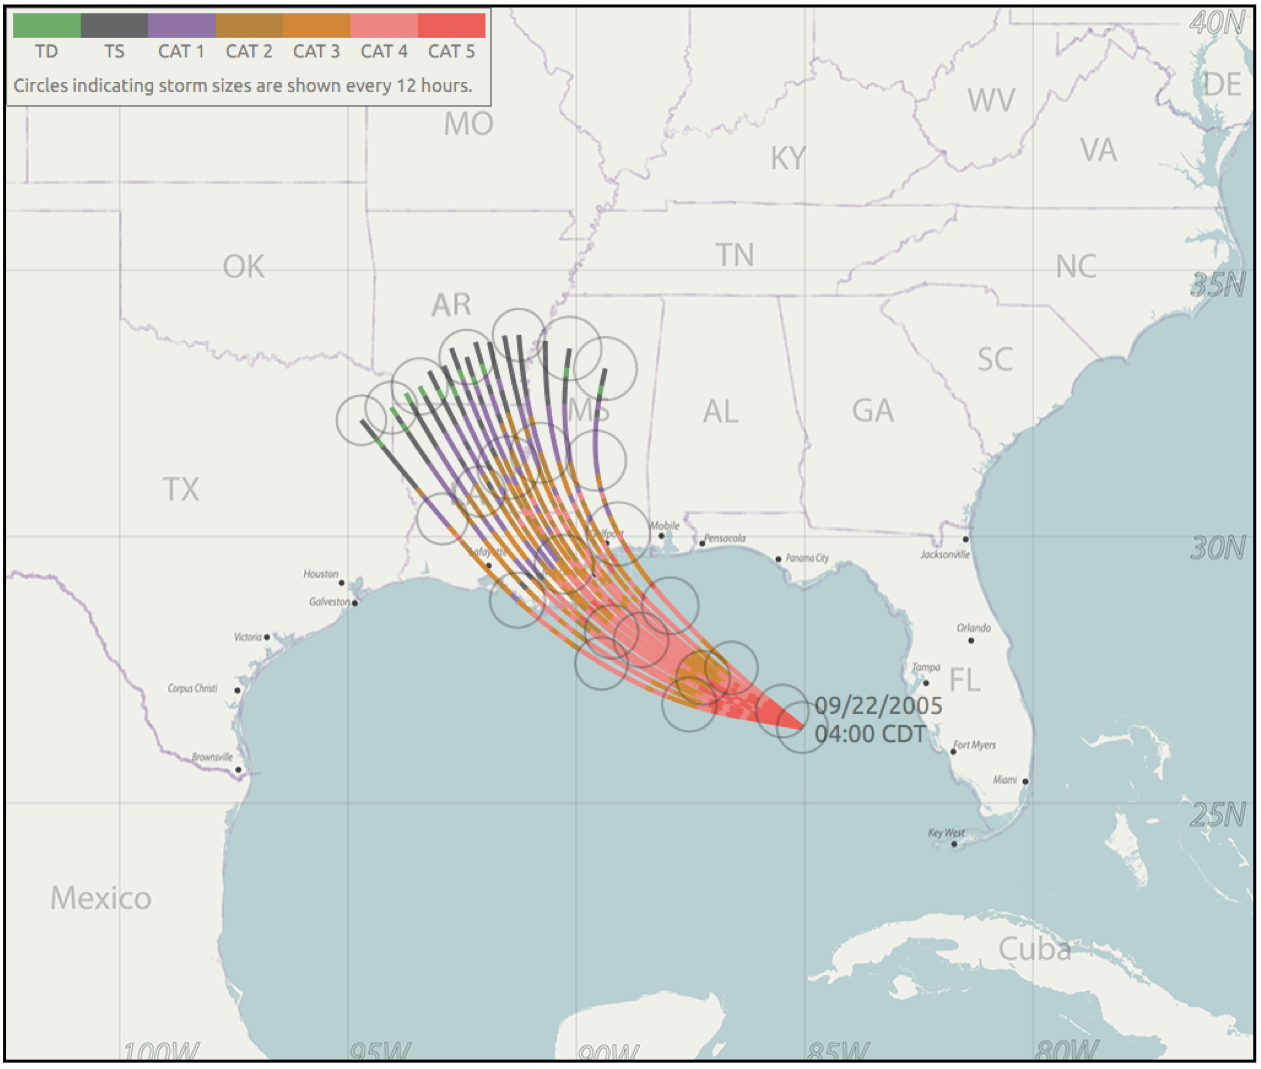
Figure 3. Example of representative direct ensemble visualization developed by (Liu et al. 2018)
A potential extension to hydrology?
As a summary, the representative direct ensemble uncertainty visualizations appear as a balance between showing the complete data and showing too little data. This technique explicitly displays a subset of an ensemble in a proper way so that the underlying uncertainty is implicitly conveyed. Its biggest advantage is to mitigate the misconceptions induced by using uncertainty glyphs, as what summary displays do. Moreover, it visualizes ensemble members using graphical elements the dimensionality of which matches that of the ensemble members, e.g. spatial locations remain 2D or 3D points, tracks remain line segments, therefore, it enables incorporation of additional characteristics of the ensemble members.
Current studies have demonstrated its superiority in hurricane forecasting, this superiority has a great potential to be extended to the hydrological community.
A straightforward thought is to improve scatter plots, which are commonly used to compare the forecast of variables of a hydrological simulation and its observations. Depending on the complexity of a simulation, multiple scatter plots depicting different variables are usually displayed simultaneously to provide an overall view of this simulation. However, because of the limited screen resolution, individual plots are inevitably small so that the users have to zoom in and out frequently to read the information. Doing so places a heavy cognitive load on the users, making it difficult for them to discover and analyze the coherence and uncertainty of the simulation results. The representative direct ensemble uncertainty visualization only displays a small number of representatives, preserving the original distribution across all available variables. This data reduction enables further visual annotations, e.g. designing decent glyphs encoding multiple variables and incorporating these glyphs in a single display to convey a more complete view of the simulation.
In addition, simulation ensembles are usually multimodal and these modalities can be hardly observed in a “naive” visualization, e.g. a spaghetti plot, when an ensemble is large. The representative direct ensemble uncertainty visualization provides a clean and structured presentation of the data and still preserves the important modalities, becoming an asset for a wide spectrum of scenarios. I am currently working on a project exploring such applications and I would be more than happy to discuss and collaborate with researchers who are interested in this topic.
References
Cox, Jonathan, Donald House, and Michael Lindell. 2013. “VISUALIZING UNCERTAINTY IN PREDICTED HURRICANE TRACKS.” International Journal for Uncertainty Quantification. https://doi.org/10.1615/int.j.uncertaintyquantification.2012003966.
Liu, Le, Lace Padilla, Sarah H. Creem-Regehr, and Donald H. House. 2018. “Visualizing Uncertain Tropical Cyclone Predictions Using Representative Samples from Ensembles of Forecast Tracks.” IEEE Transactions on Visualization and Computer Graphics, August. https://doi.org/10.1109/TVCG.2018.2865193.
Ruginski, Ian T., Alexander P. Boone, Lace M. Padilla, Le Liu, Nahal Heydari, Heidi S. Kramer, Mary Hegarty, William B. Thompson, Donald H. House, and Sarah H. Creem-Regehr. 2016. “Non-Expert Interpretations of Hurricane Forecast Uncertainty Visualizations.” Spatial Cognition & Computation. https://doi.org/10.1080/13875868.2015.1137577.
0 comments