Why did the Californian water authorities favour biased rain forecasts?
Contributed by Anders Persson
As you may know, one of the more lively and inventive weather services in Europe is the regional meteorological office in Bologna. They have not only developed a good limited area model (COSMO) but also an ensemble system (COSMO LEPS) to complement it.
They have also, like me, come to the conclusion that using probabilistic systems demands some knowledge and feeling for probabilities. For that purpose they are arranging a course in February “Probability and uncertainty: two concepts to be expanded in meteorology”.
I have the honour to be one of the invited lecturers and presently I am busy preparing my presentations, drawing partly on previous seminars and lectures. Doing so, I am sometimes confronted with the problem to understand myself or things I have said previously! Here some examples I would like to share with you.
The sack with marbles
In a seminar in 2005, I seem to have said, en passant, something like this:

source: Wikipedia Commons
“Consider a sack with a large number of bland and white marbles in unknown proportions. Draw one. Then draw another one. The probability that the second has the same colour as the first is 2/3.”
This sounds ridiculous. How could I have said that? There was no explanation and I remember only vaguely that I had seen it in a book, now forgotten.
It is elementary knowledge that if there are 80% (0.8) black marbles the chance of drawing two identical is 64% (0.82=0.64) and 4% for both white 0.22=0.04). And if there were 30% (0.3) blacks the chance would be 9% (0.32=0.09) and 49% for both white marbles (0.72=0.49).
But then it struck me that these were answers to questions never raised. It was not about black or white, but about both colours without specifying which was more or less numerous. And 64% + 4% = 68% and 49% + 9% = 58% are both not far from 2/3 = 67%.
Then I realised that, if P is the proportion of black marbles and 1-P the proportion of white marbles, the chance of getting identical colours is :
P2 + (1-P)2 = 2P2 – 2P + 1.
If you integrate you’ll have:
2P3/3 – P2 + P + const
Which, evaluated from 0% to 100%, yields 2/3!!
Encouraged by this, I posed the question: – If both marbles drawn from the sack are black, what does that tell us about the likely proportions between black and white marbles in the sack?
This leads into very interesting calculations which are sometimes called “Bayesian” which I will not reveal here, but you are welcome to Bologna to find out! Or wait until my next blog post!
But there is another headache I would like to share with you… and where I do not have the answers!
The 1930’s Californian weather service
To illustrate the advantage of probabilistic weather forecasts compared to deterministic forecasts, I used in 2005 an example from the 1930’s dry and sunny California.
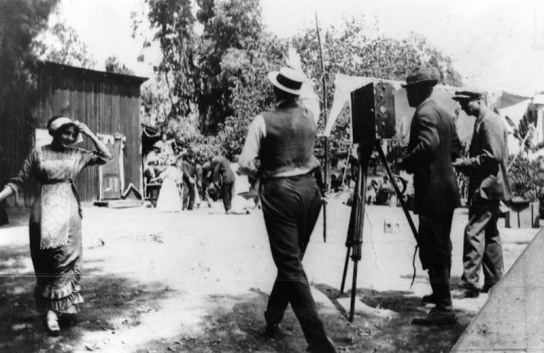
source: here
A newly created private weather service earned loads of $$$$$ supplying its customers with highly biased rain forecasts. Sounds stupid, but these customers were the Hollywood movie industry and the Californian water industry. The former didn’t want to risk huge costs by being surprised by rain when they were shooting outdoor so they got forecasts highly over-estimating the frequencies of rain. They didn’t mind false rain alarms. The water industry (water dams for electric power and irrigation) got forecasts which rarely mentioned rain unless it was pretty certain to happen. They didn’t mind missed rain events.
In 2005, I had explained this by their interest to avoid over-filling and possible damages to the dam by spilling off water. But this would be done unnecessarily if there was no rain. But ten years later, 2015, I do not quite understand this explanation. Because if the dam is almost full and you risk over-filling, then of course you would be equally concerned with non-predicted rain. But they were not.
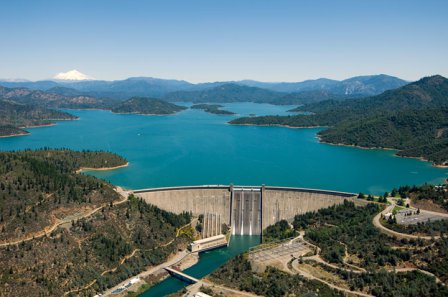
source: Wikimedia Commons
Perhaps it was not about the water volumes as such, but the commercial side? When it was raining the irrigation people didn’t need to buy water, unless the price was radically lowered. Knowing when rain was absolutely sure the weather authorities could in advance offer those cheaper prices. And then of course if there was no rain, they would have lowered the prices unnecessarily.
But I am not sure this is true. I know very little about water economy and nothing about the hydrological culture in California, in particular in the 1930’s.
So is there anybody out there who does? Or who can give some other, perhaps completely different explanation to why weather authorities (in any part of the world at any time) would favour under-prediction of rain in this way?
January 23, 2015 at 14:49
Maria-Helena, perhaps I can help some, at least, with part of your question regarding your statement “I know very little about water economy and nothing about the hydrological culture in California, in particular in the 1930’s” and asking for some guidance. The book “The Cadillac Desert”, which is avialable from Amazon.com (http://www.amazon.com/Cadillac-Desert-American-Disappearing-Revised/dp/0140178244) and as an iBook for Apple iPads. The book has received many awards as a definitive source on water issues in the western U.S.
January 23, 2015 at 15:01
Maria-Helena, I think I found a good paper describing the utility of a positive bias in forecasting; please see: http://sites.duke.edu/sarahtaylor/files/2014/10/Raymond-and-Taylor-Media-Bias.pdf — look particularly at the Discussion section at the end of the paper.
January 27, 2015 at 10:51
Thanks for the suggestions. I am not sure I will be able to purchase or read the book before the Bologna lectures, but the pdf paper really seems to fit into the agenda. Any more ideas or example why the public or our customers, for good reasons, sometimes do not behave as we expect them to do??
January 27, 2015 at 13:17
Thank you for the comments. As I am just the person who posted it (Anders was the one who actually wrote it), I will let him answer in more details. The references look great, thanks!
ps: tea3rd, it would be nice if we could have a name/affiliation too! 🙂
February 13, 2015 at 23:36
Tom Adams! Nice to hear from you 😉
January 28, 2015 at 17:26
It has nothing to do with the water conditions in California in the 1930’s, but where else should I put a comment on what “everybody” is talking about just now: the snow storm that never came to New York?
It was impossible not to go out with a strong warning about severe weather conditions. All the model, all the ensembles and all the members in the ensembles supported this – until the very last moment.
However, there is really no need to go out with a 100% confident forecast about a threatening catastrophe. A lower probability would still motivate protective action. Warning on an 80-90% level would have been enough. Had a tsunami been threatening NY a warning on a 5% level would be enough.
Besides, the ECMWF ensemble has only 50 members. From a mathematical viewpoint [prob= n+1/(50+2) ] this means that only probabilities between 2% and 98% are possible. If no member [n=0] has the event the probability is 2%, if all have it [n=50] it is 98%. One member would correspond to almost 4% with a “right” to be wrong every 25th time . . .
January 28, 2015 at 19:34
I just had the very same thought this morning while listening to the morning show on the radio. The question of the day was « what do you think of the accuracy of weather forecasts?». The answers on the facebook page of the radio show were very negative (more than I would have thought). Most people did not give ANY credibility to weather forecasts. One person even wrote that weather forecasts nowadays are worse than they used to be! However, it was interesting to hear (during the same show) that New-York City’s mayor does not regret the safety measures he took. This is a good example of a case where the decision maker is risk averse and prefers false alarms over missed events.
January 30, 2015 at 13:25
Marie-Amélie: I wouldn’t be surprised if the man who said that “weather forecasts nowadays are worse than they used to be” is right.
The presentation of weather on the web nowadays is in the hands of IT-people who want to show the world how proud they are of their high-resolution models.
If the output is not statistically or in other ways post-processed the forecasts will be, or at least (through the ”jumpiness”) give an impression of being worse.
January 30, 2015 at 13:20
The article “tea3rd” made me aware of was quite interesting.
During the 1890’s the probability of a rainy day in New York was 1/3 (33%). During 1890-96 New York Times published weather forecasts from the US Weather Bureau in Washington. They tended to slightly over-predict rain by a few percent. Note: this has nothing to do with the forecast accuracy, it measures just how often rain was predicted. When probabilities are not used, over-prediction of important weather is necessary. A few percent s a rather low figure, I would say.
In summer 1896 the newspaper hired their own, New York based, weather forecaster. The over prediction of rain increased by 11% during 1896-99. These 11% look more realistic to me and might reflect the importance of rain by the local population.
However, when the city’s favourite baseball team “New York Giants” played a home match, the local weather forecaster underpredicted rain by a few percent, almost 15% less than the normal 11% over-prediction frequency. The under-prediction was even larger when the “New York Giants” had a good season (and more people would like to go out and watch them) and less when they had a bad season (when their supporters cared less).
The pre-1896 Weather Bureau forecasts did, of course, display no correlation, or “bias”, to the whereabouts of the New York Giants’ matches.
There is probably more to learn from this interesting paper. My problem was that while meteorologists tend to measure hit rates by (number of hits)/(number of rain forecasts) the statisticians measure it as (number of hits)/(number of rain occasions).