Flooding in Pakistan 2014 – Was it predictable?
Contributed by Linus Magnusson, Florian Pappenberger, Ervin Zsoter and S.H.M. Fakhruddin
The Pakistan flooding of 2014 was subject of a recent blog in which the “lesson’s identified never learnt” have been investigated. Similar to previous events this flooding (2010 flooding in the Kabul river) affected a large number of people and had a devastating effect on the population. In this blog, we analyse the atmospheric predictability of this event. In summary, we show that there has been a signal indicating flooding as early as the 30th of August, which can be seen in the precipitation forecasts of ECMWF as well as in the discharge forecasts of the Global Flood Awareness System.
3-day accumulation of precipitation between 3 September 00UTC and 6 September 00UTC (click on plot to enlarge)
Pakistan is one of the five South Asian countries with the highest annual average number of people physically exposed to floods. There are several factors that trigger these frequent floods. These are storm systems that originate from Bay of Bengal during the monsoon from July to September, extreme rainfall in monsoon, peak snowmelt runoff, GOLF event in summer season, and the collapse of several dams.
Heavy monsoon rain in the first week of September led to flooding in north-eastern Pakistan. The catchment of Rawal River (tributary of Indus) received 298 mm at Islamabad, which is 48% more than the normal seasonal rainfall. At the Murree gauge station, 79% more rainfall occurred than the normal seasonal rainfall. In the 3 days of accumulated precipitation, from the 3rd to the 6th of September, precipitation exceeded 300mm, as reported at the border between Pakistan and India.
Predictability
ECMWF High resolution forecast issued on the 1st of September 12 UTC (click on plot to enlarge)
ECMWF high resolution forecast (~grid size 16km) shows a clear signal for extreme precipitation from the 1st of September onwards, with a pattern similar to the observations. A maximum of 200-250mm accumulated precipitation is predicted three days before the event, which raises to 250-300mm for the period from the 3rd to the 6th of September, just immediately before the event. The spatial pattern is a reasonable representation of the observations.
Probability for more than 100 mm during the 72-hour period (3-6 September) from forecasts with different initial times for the forecast issued on the 31st of August 00 UTC (click on plot to enlarge)
The ensemble forecast already shows an indication of the extreme event from the 30th of August onwards. The figure on the right shows the probability of exceeding 100mm in 72 hours. A first signal with a probability of 10-20% appears on the 30th of August 00UTC. The probability then steadily increases as well as the areal extent.
It is important to set the precipitation amounts with respect to climate. ECMWF computes the Extreme Forecast Index and Shift of Tail Index which compare predicting distributions of variables with climatic distributions. The indices reach a value of 1 (or -1) for extreme values.
In the figure below, the Extreme Forecast Index for precipitation is shown. It also indicates extreme precipitation from the 31/30st of August onwards.
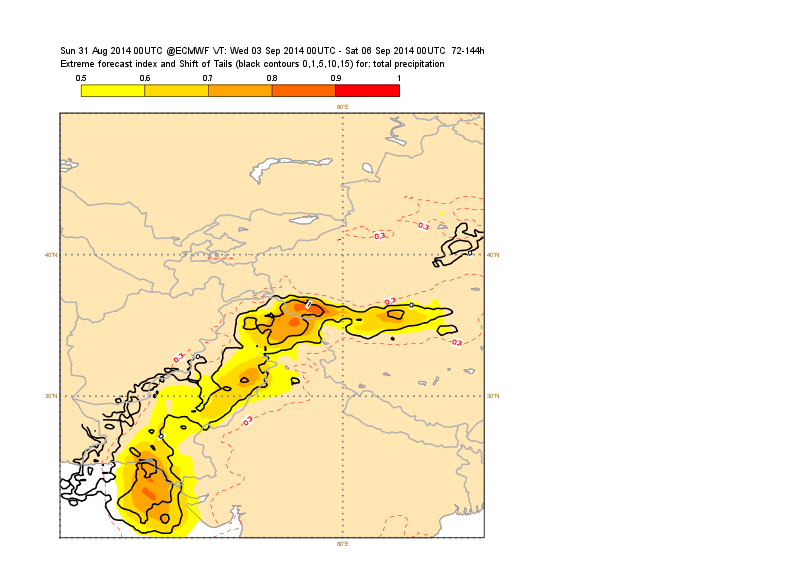
EFI and SOT for 3-day accumulation of precipitation for the forecast issued on the 31st of August 00 UTC (Click on plot to enlarge)
Monthly precipitation forecast. The analysis si shown in the top panel. The figure shows the ensemble mean anomalies for the week 1-7 September from different monthly forecasts, including the analysis (top panel)
Monthly precipitation forecast. The analysis is shown in the top panel. The figure shows the ensemble mean anomalies for the week 1-7 September from different monthly forecasts, including the analysis (top panel) (click on plot to enlarge)
The figure on the left analyzes the monthly forecast and shows the ensemble mean anomalies for the week 1-7 September from different monthly forecasts, including the analysis (top panel). The first forecast is from 28 August.
As seen in the EFI plot, the signal was not strong for this forecast, but a wet anomaly is present for southern Pakistan. A wet anomaly was also present in the forecast from a week earlier (21 August), but still a bit too far south. There is a signal of wet conditions already 2-3 weeks in advance. However, there are also areas that exhibit a strong signal which was not verified.
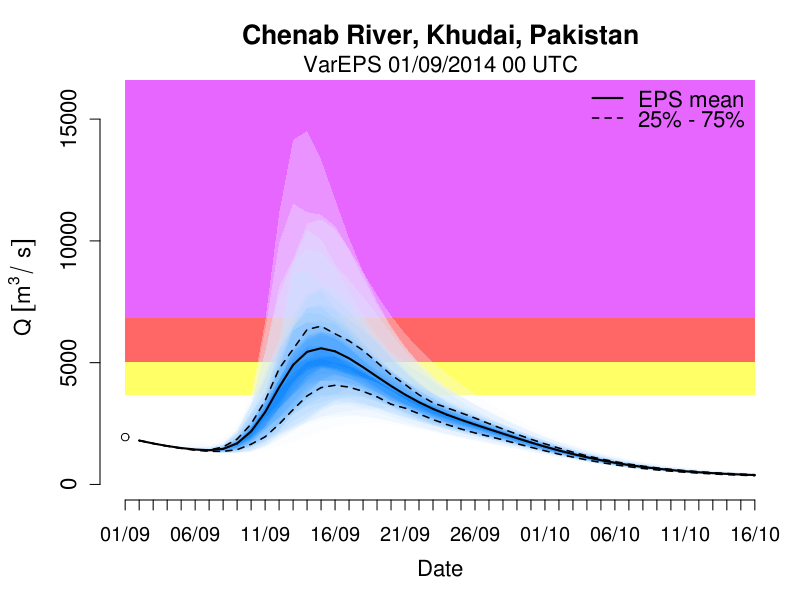
Flood forecasts from the Global Flood Awareness System issued on the 01 September 00 UTC.
Flood forecasts from the Global Flood Awareness System issued on the 01 September 00 UTC.
The findings of the meteorological forcing are replicated in the Global Flood Awareness System (figure on the right), which would have allowed to anticipate flooding from the 1st of September onwards.
October 15, 2014 at 05:12
Linus Magnusson, Florian Pappenberger, Ervin Zsoter and S.H.M. Fakhruddin, thank you. I believe you make a very interesting point, perhaps inadvertently. Namely, while we may not always be able to pinpoint the exact basin where significant flooding is likely to occur, we can generally identify regions (with many forecast point locations) where significant flooding is likely to occur. This was my experience with our development of the (now) operational Meteorological Model-based Ensemble Forecast System (MMEFS), which can be found at http://www.erh.noaa.gov/mmefs/index.php?Lat=39&Lon=-84&Zoom=6 at the NOAA/NWS Ohio River Forecast Center. During the several years of testing the MMEFS as an experimental system and nearly two years of operational use, albeit anecdotally, we consistently saw the forecast system correctly identify regions where significant flooding was likely to occur, with lead times of 4 to 7 days.